The profitability of each building, calculated from the accounts
The reporting figures are calculated from the invoices, payments and statements recorded in Odoo. Nothing is re-keyed. The Analysis menu groups the tables described below.
The portfolio dashboard, at the top of the Analysis menu
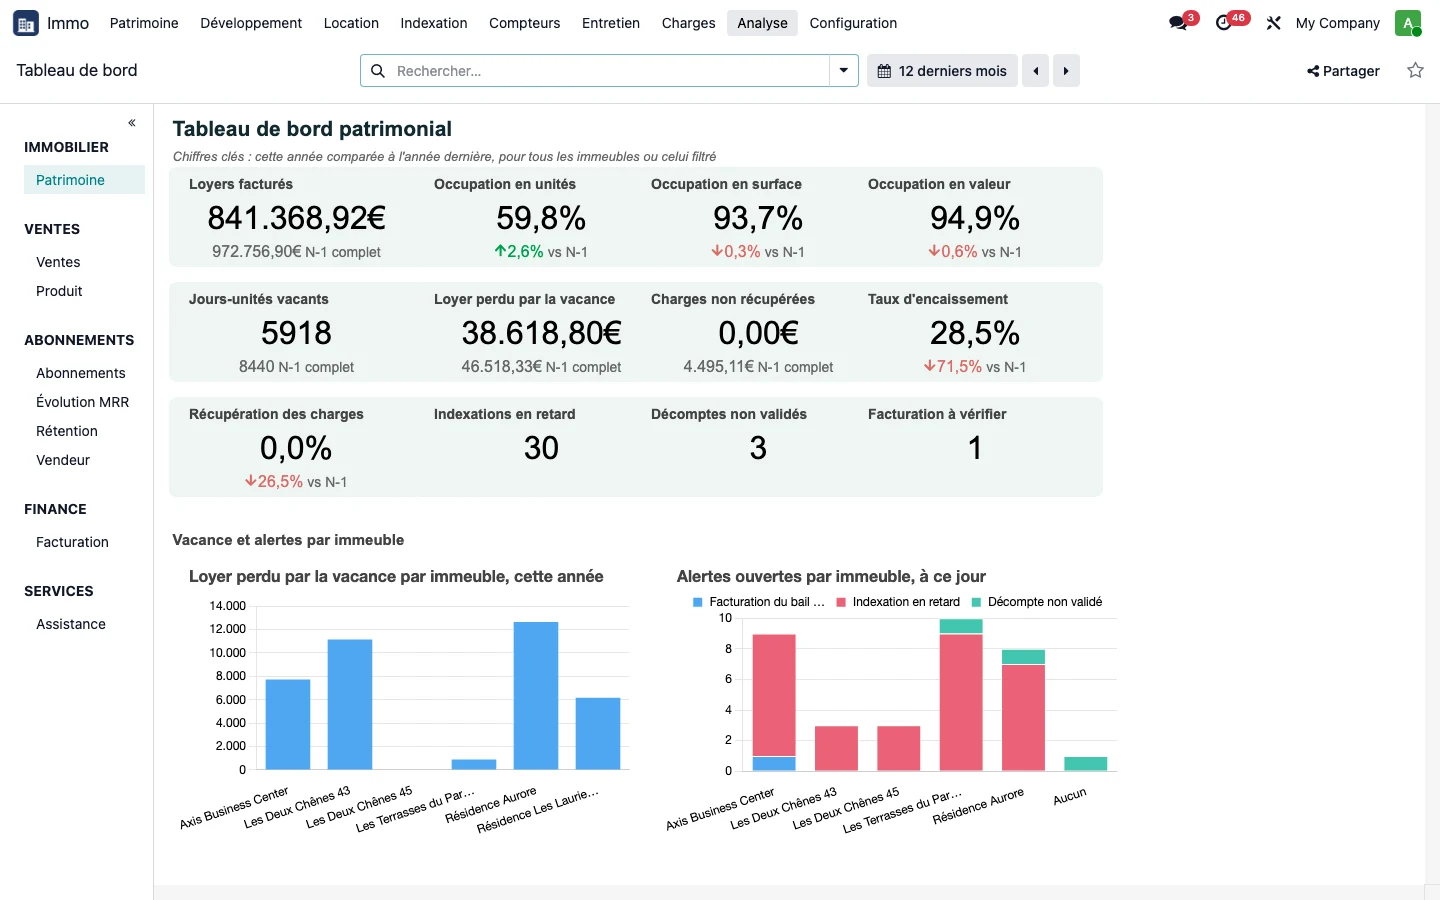
The first entry of the Analysis menu opens a dashboard that sets the current year against last year: rent invoiced, occupancy by units, by area and by value, vacant unit-days, rent lost through vacancy, unrecovered service charges, collection rate and service charge recovery. Three cards count the alerts to be dealt with: overdue indexations, unvalidated statements and invoicing to be checked. The Alerts list gives the detail.
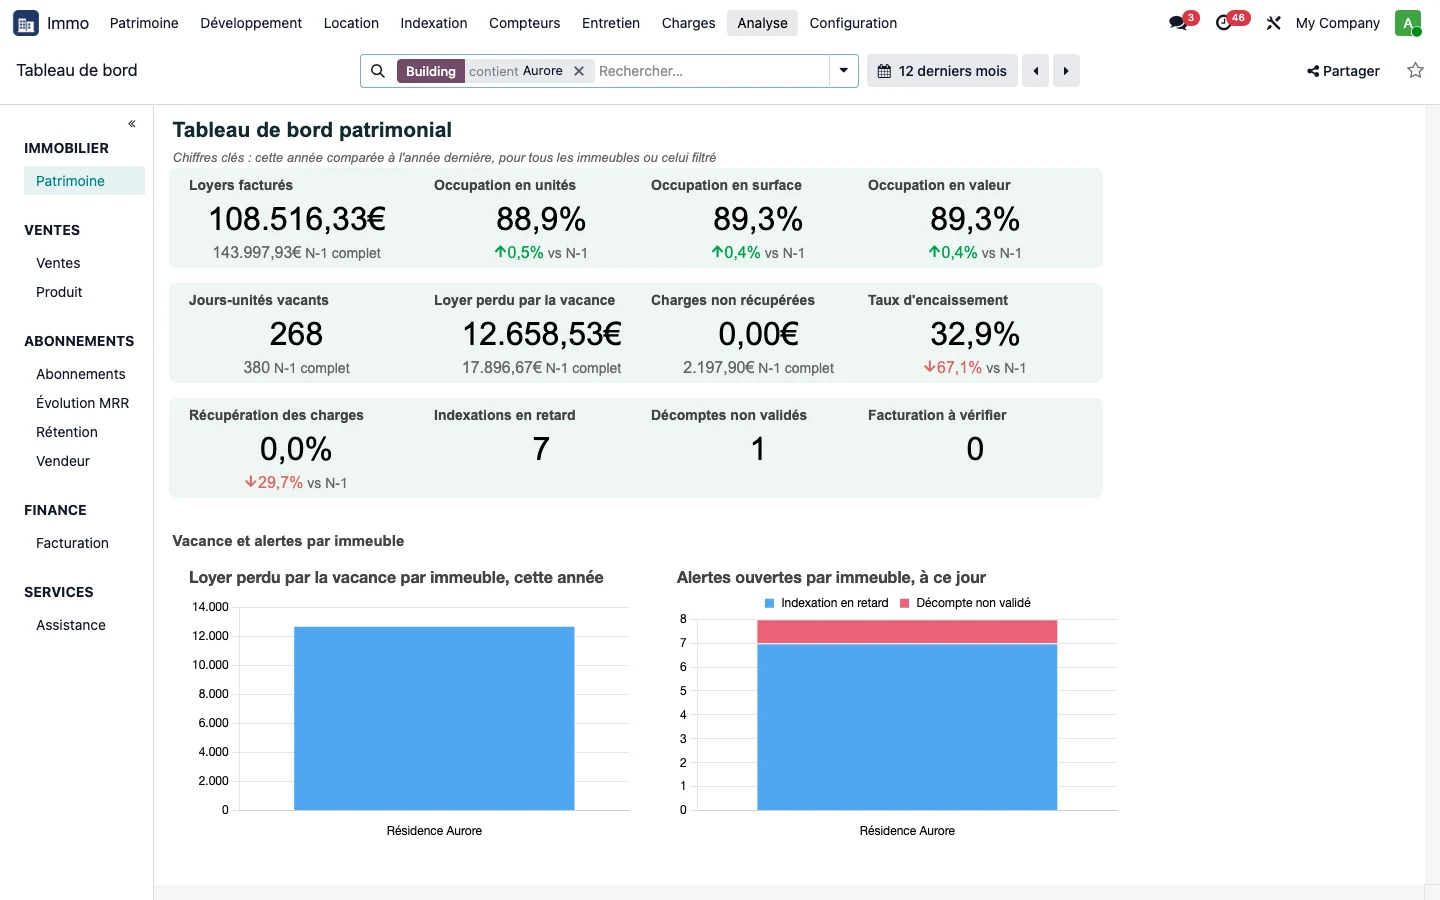
Below the cards, two charts by building show the rent lost through vacancy and the open alerts, then a table ranks the buildings by rent invoiced. Filtering on a building recalculates the whole page for that building. A year in progress is not compared as a percentage with a full year. Each company only sees its own buildings, or those it manages for an owner.
On the demonstration database, the occupancy rate can be recalculated by hand from the days let and the days available, the lost rent is the difference between the reference rent of the portfolio and that of the days let, and the alert counters equal the number of lines in the Alerts list. The dashboard is a spreadsheet linked to the data: with Odoo Enterprise, an indicator can be added without any development. See the step-by-step guide.
Profitability by building
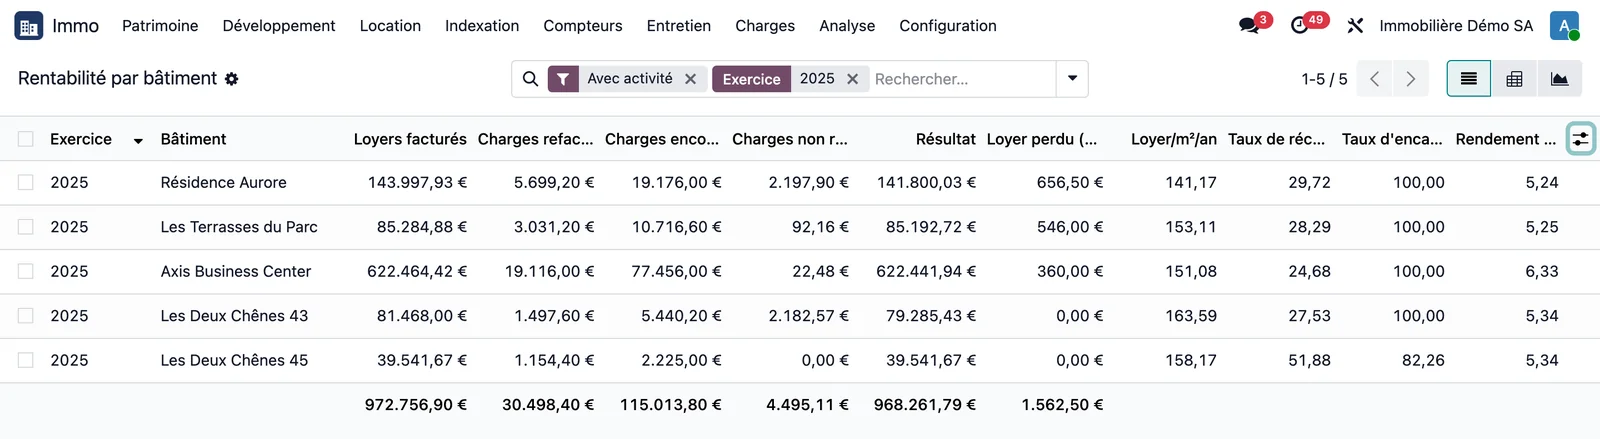
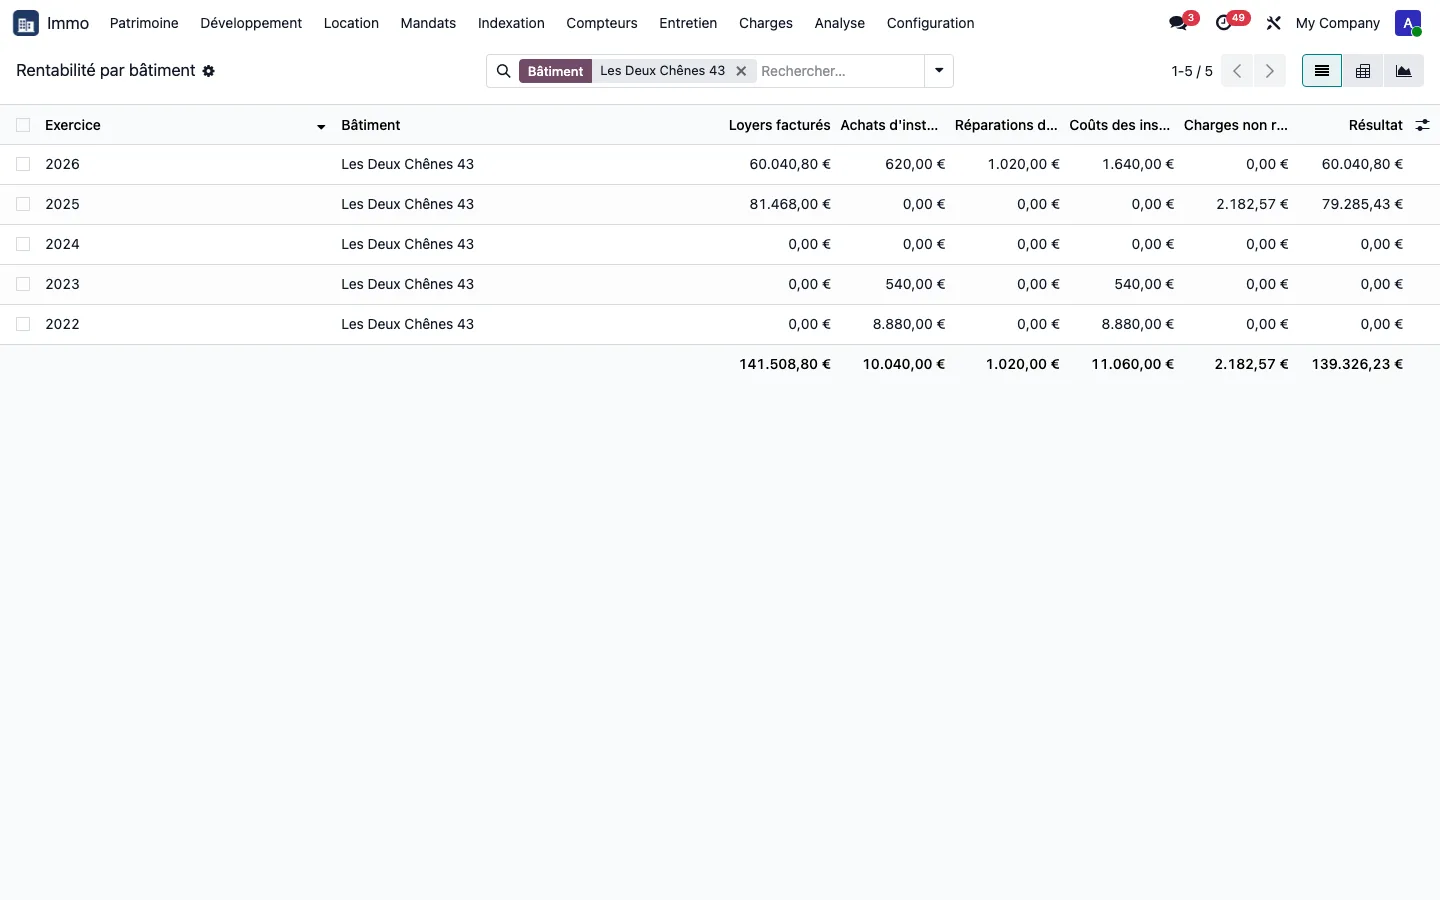
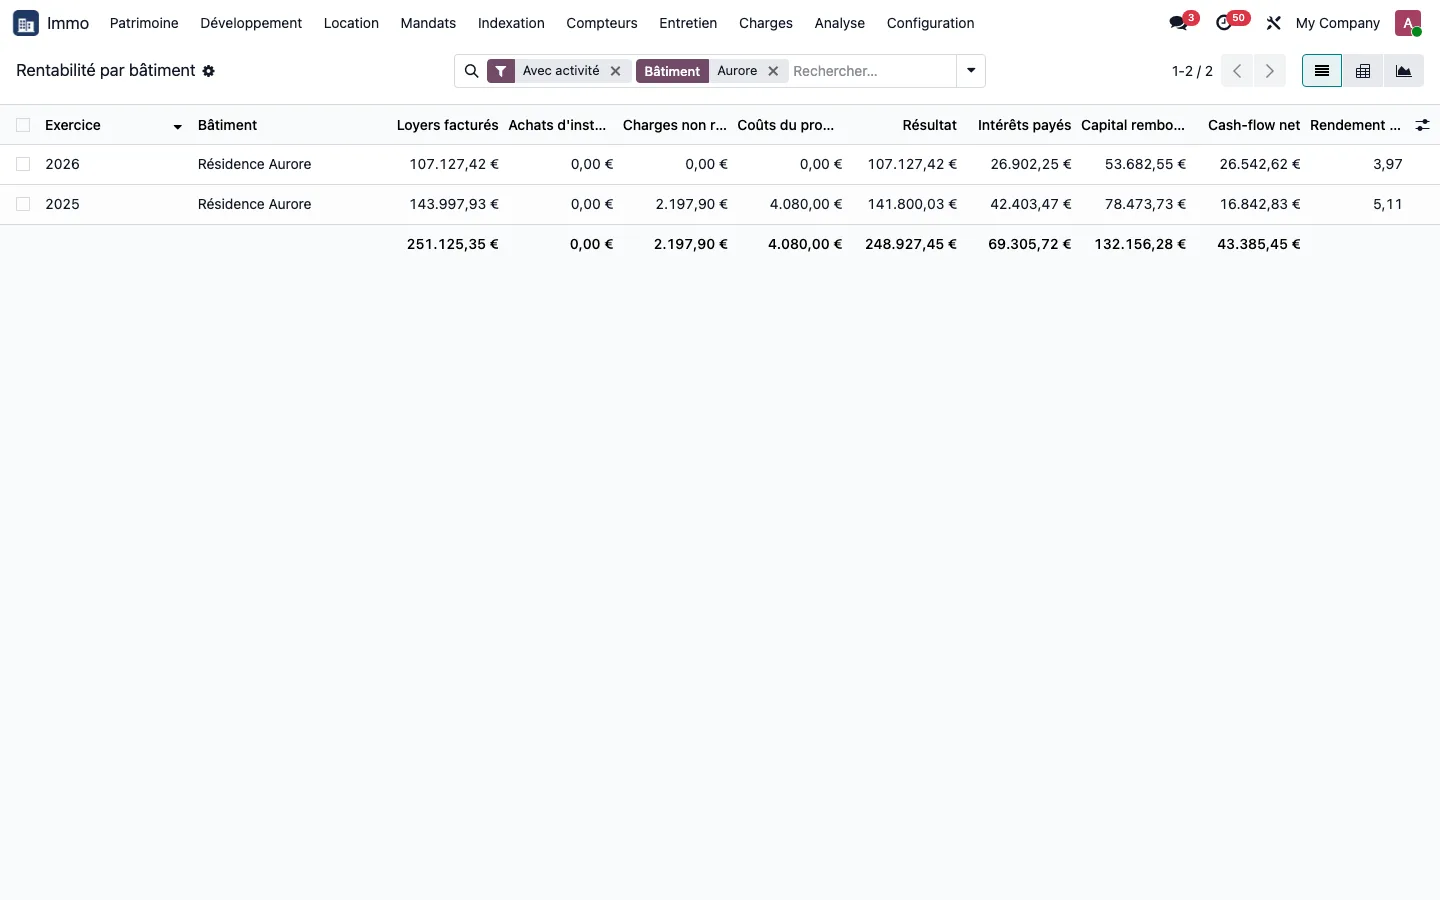
By building and by financial year: rent invoiced, service charges incurred, service charges recharged, unrecovered service charges, result, vacancy days, lost rent, rent per m² per year, service charge recovery rate and gross yield. The purchases, repairs and installation costs of each building are also added up in this table, year by year, and reconcile with the record of each appliance.
Financing by building
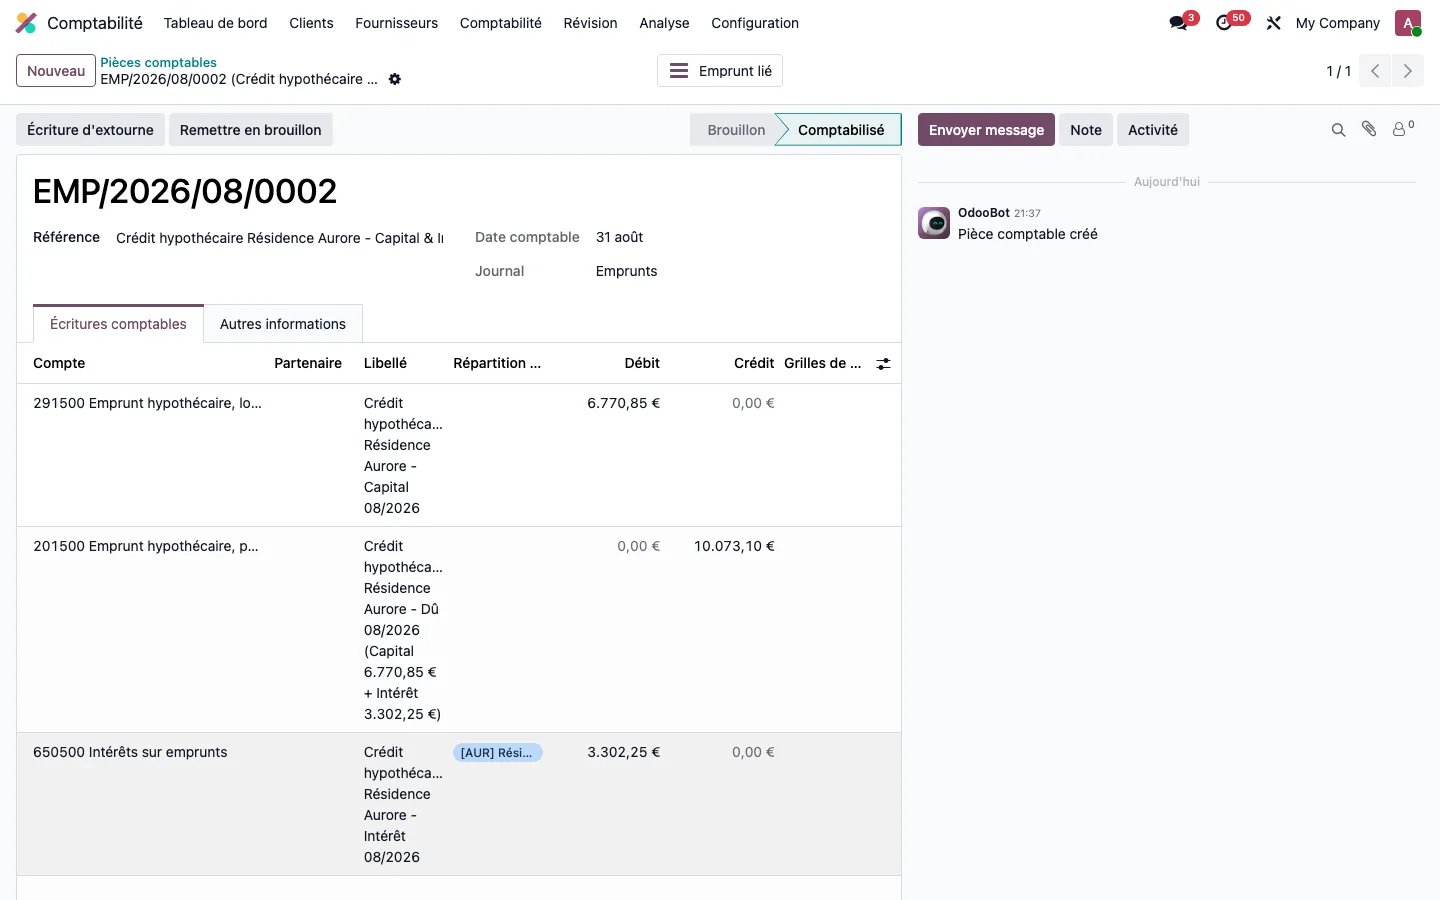
A loan in the Odoo accounts is linked to the building it finances: its interest goes to the building's analytic account at each instalment, the capital does not. Profitability by building deducts both from the result to give a net cash flow and a net yield on the total investment (purchase value, acquisition costs, renovation works), year by year, alongside the gross yield.
On the demonstration database, Résidence Aurore, financial year 2025: result €141,800.03, interest €42,403.47, capital repaid €78,473.73, net cash flow €16,842.83, net yield 5.11% on a total investment of €2,697,250.00. The interest in the building's analytic account totals the same €42,403.47.
Actual rent trends
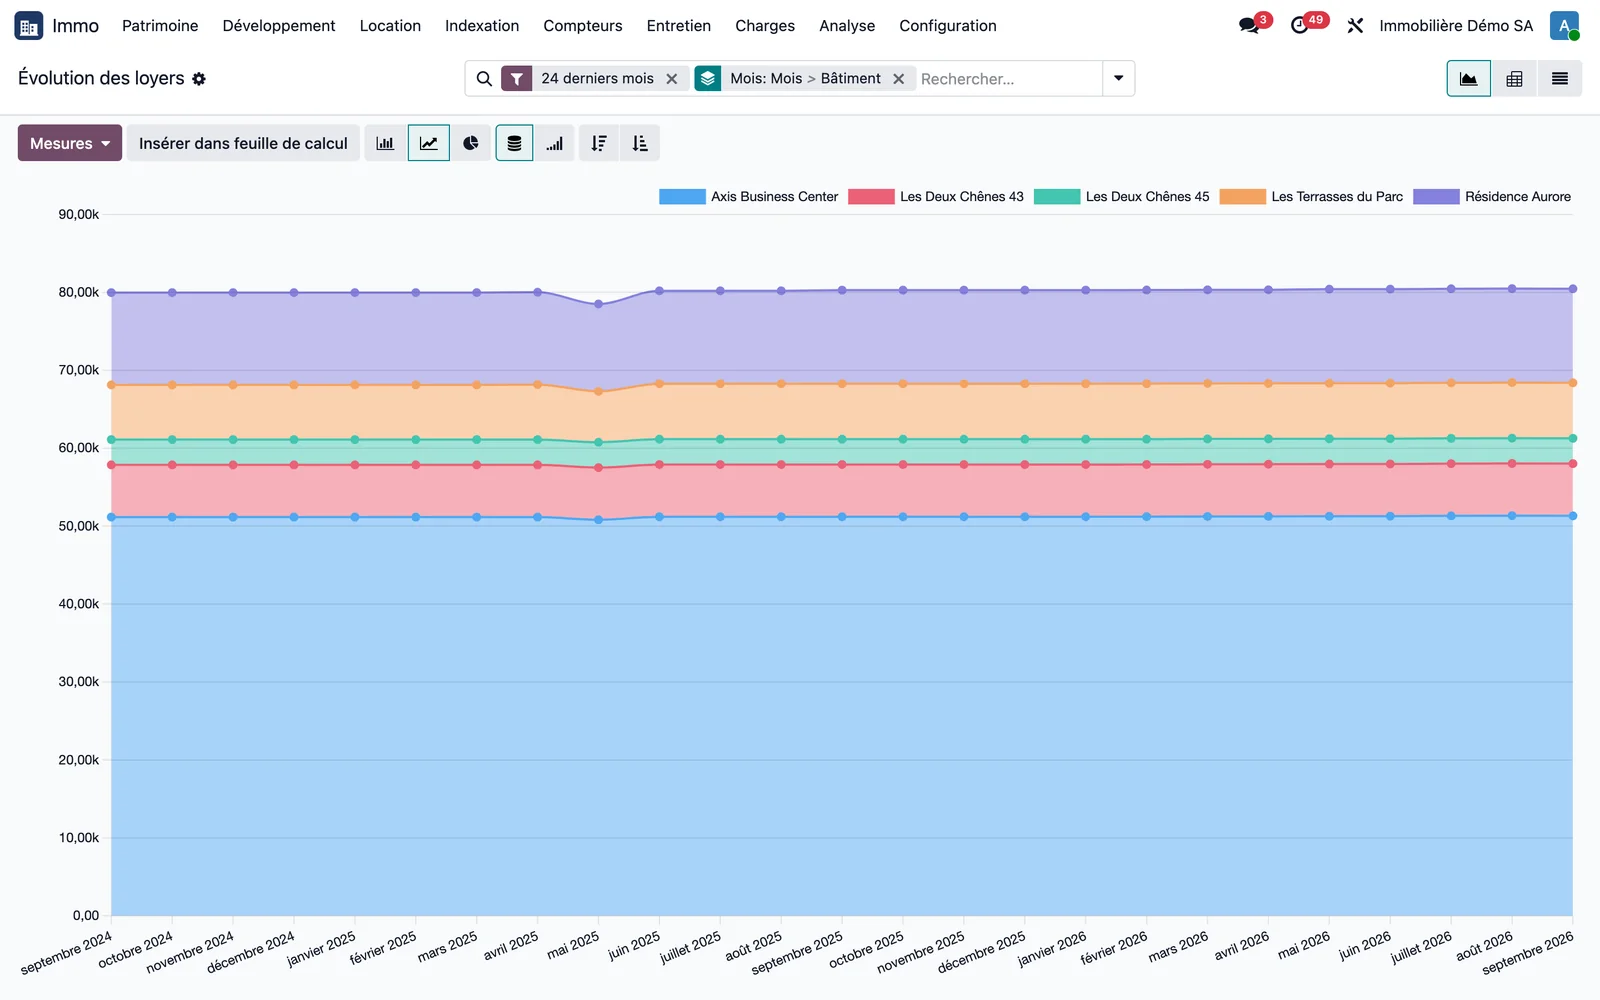
The curve reconstructs the rent actually applicable each month, from the indexations and rent steps applied. It is not today's rent projected back into the past. Vacant months appear as separate lines, valued at the unit's reference rent, and the month of a turnover is prorated by the day.
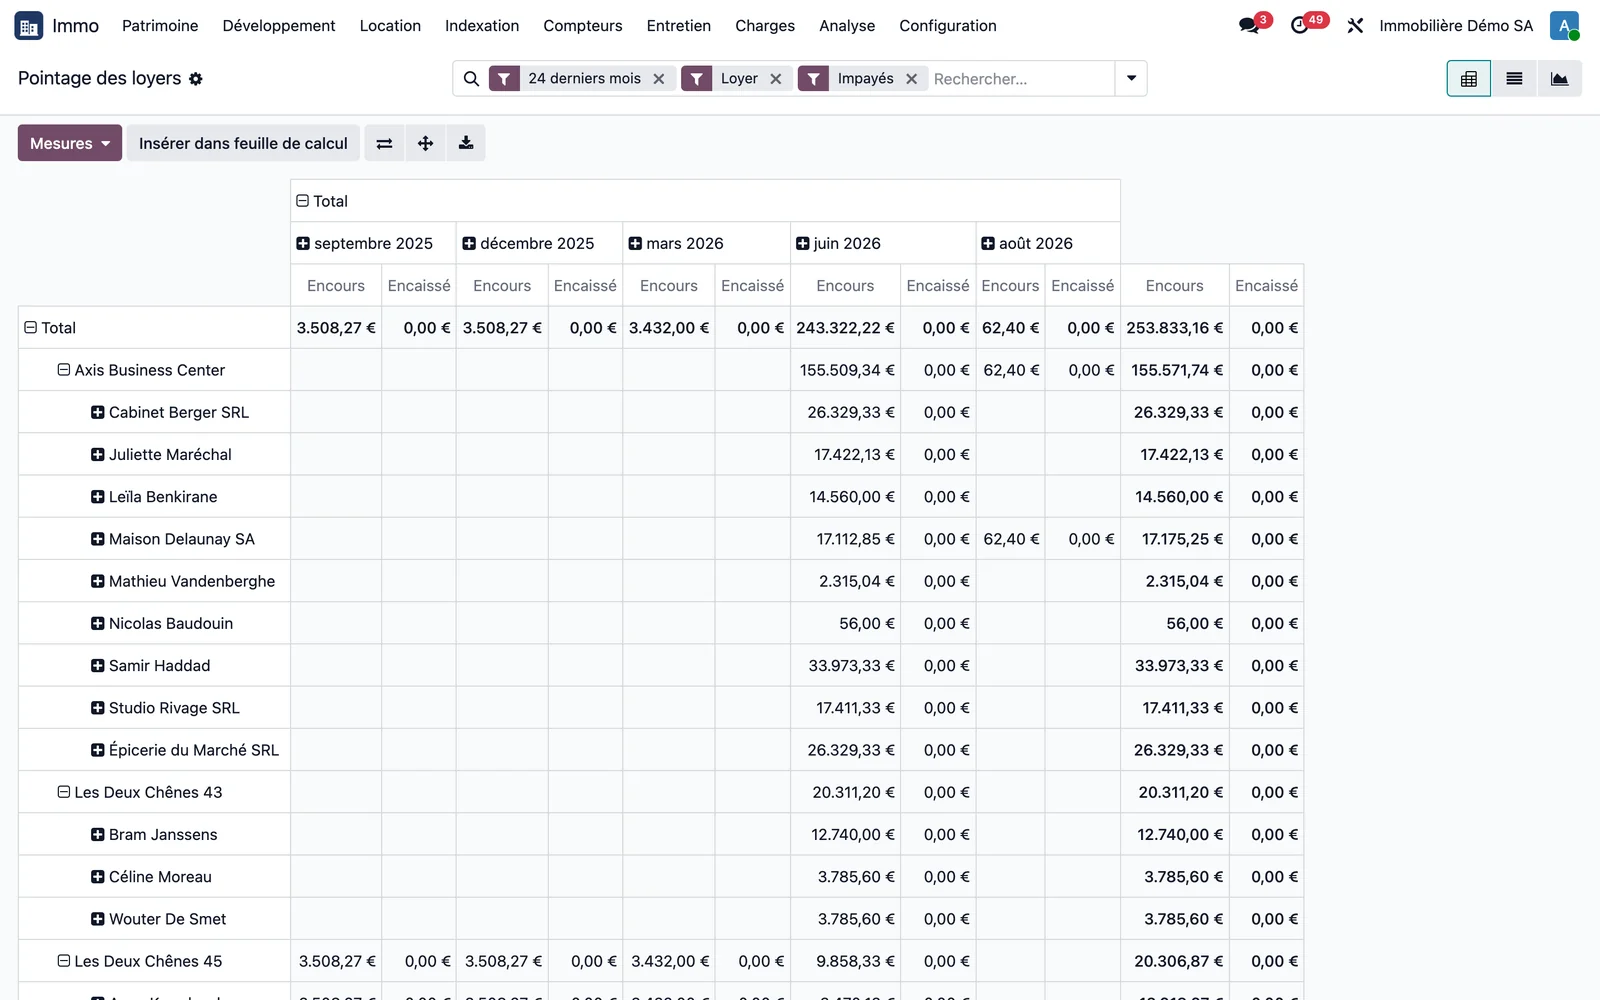
Rent collection reconciliation by building
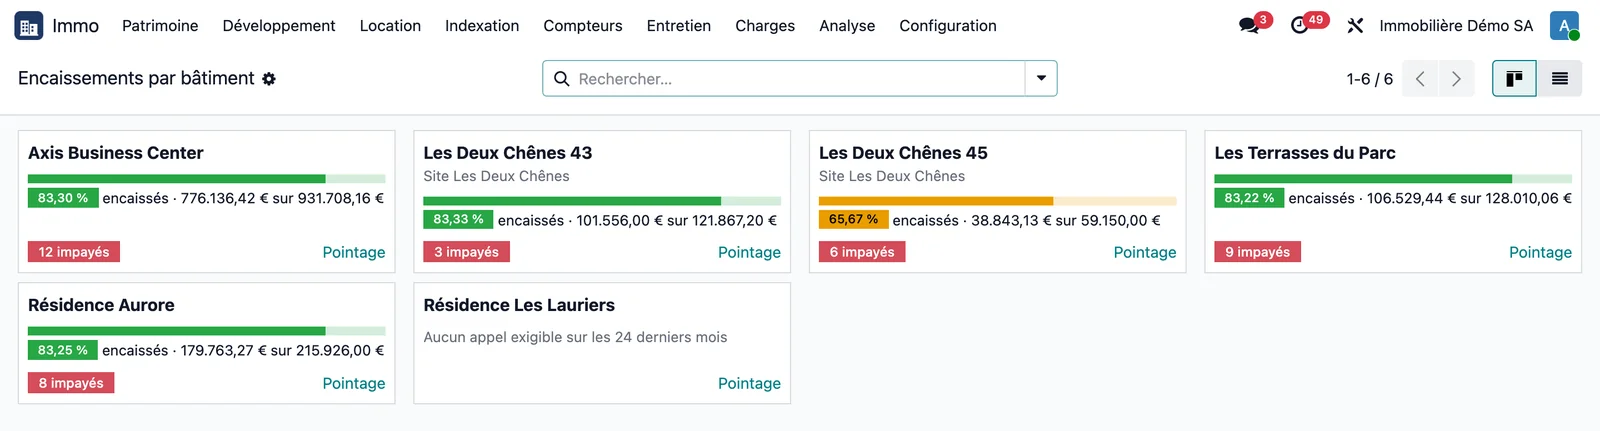
The "Collections by building" dashboard displays one card per building: collection rate, amount collected against amount due, number of unpaid calls. The bar changes from red to orange then green according to two thresholds that you set, and a grace period prevents all buildings from turning red on the first of the month.
The Reconciliation button opens exactly what the card counted: buildings and tenants in rows, months in columns, fed by bank reconciliation. The property manager can add their own manual reconciliation, and export it all to a formatted Excel file, green and red by month.
The other tables in the Analysis menu
- Occupancy and vacancy.
- Impact of indexations.
- Service charges by type.
- Allocation of service charges by tenant.
The service charge advances balance can be read as a pivot table under Service charges > Service charge advances, and rent-free periods granted under Rental > Rent-free periods.
The portfolio dashboard, described at the top of the page, brings together the main indicators on a single screen.
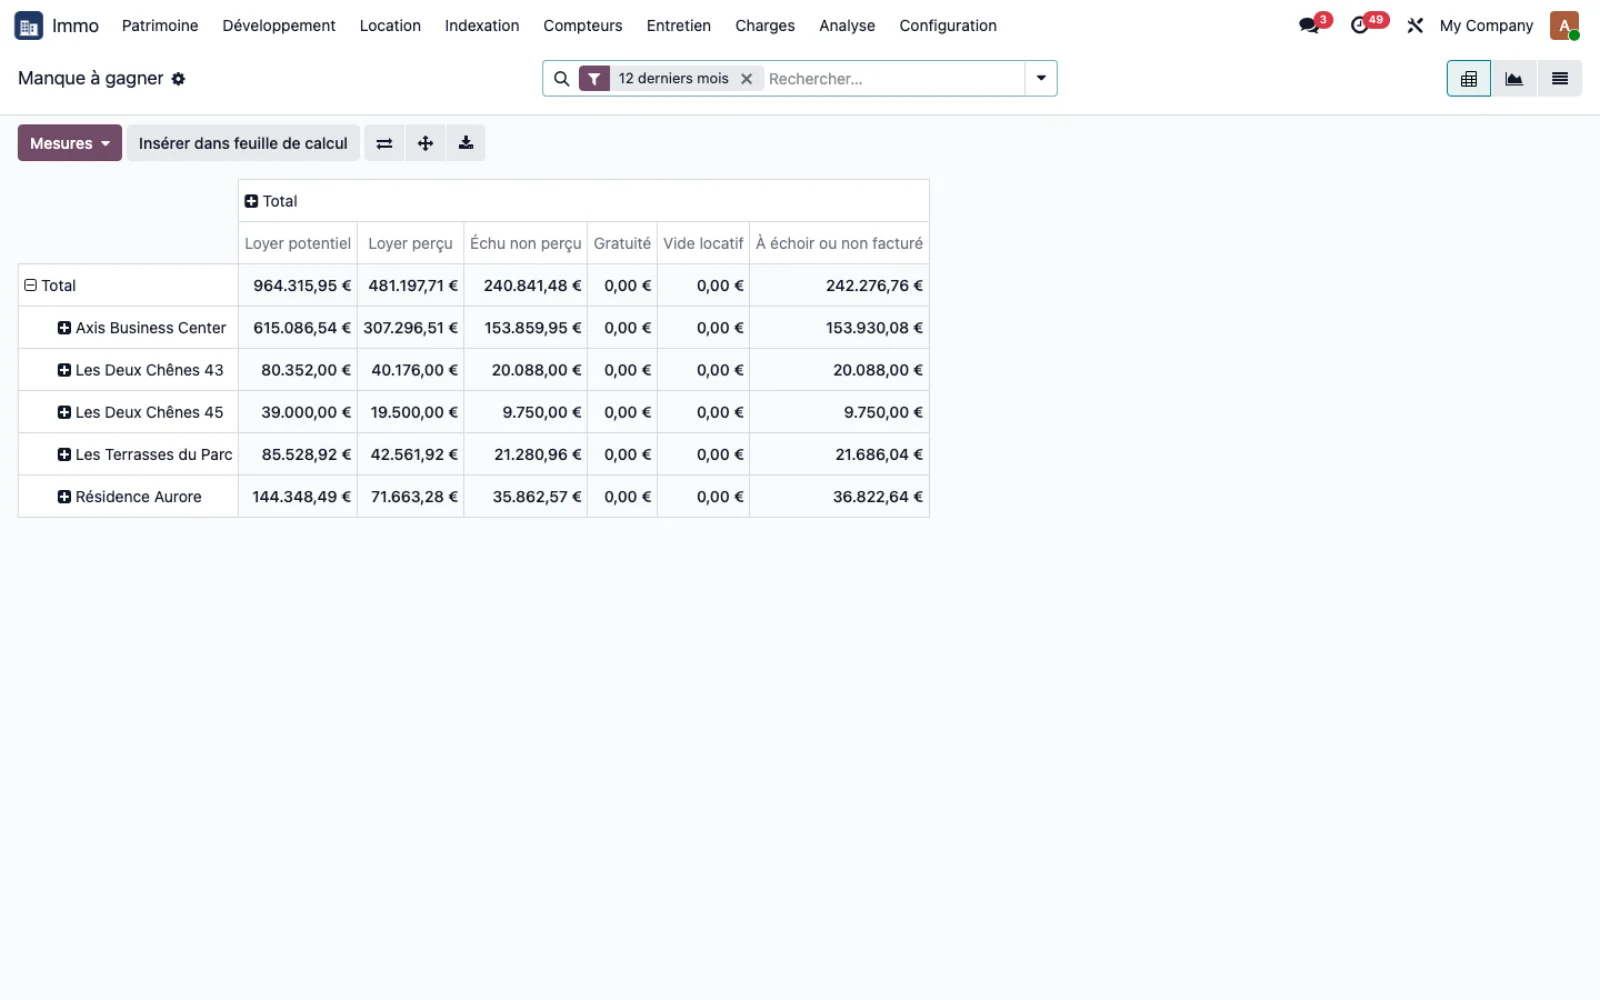
Shortfall and ageing by building
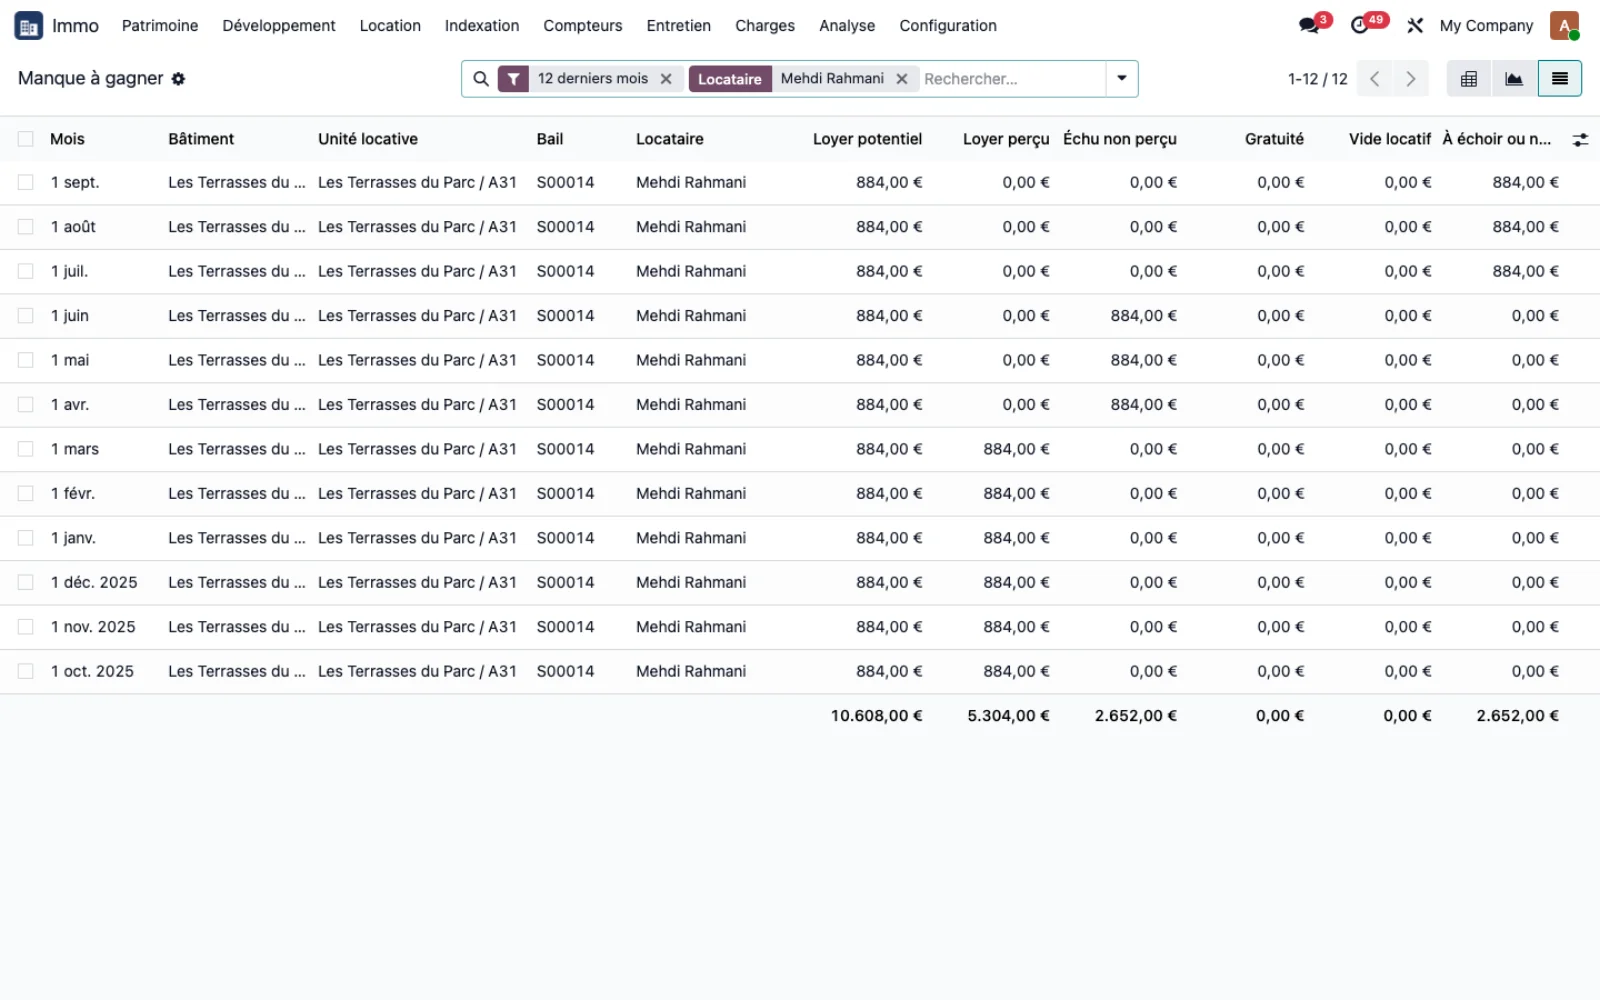
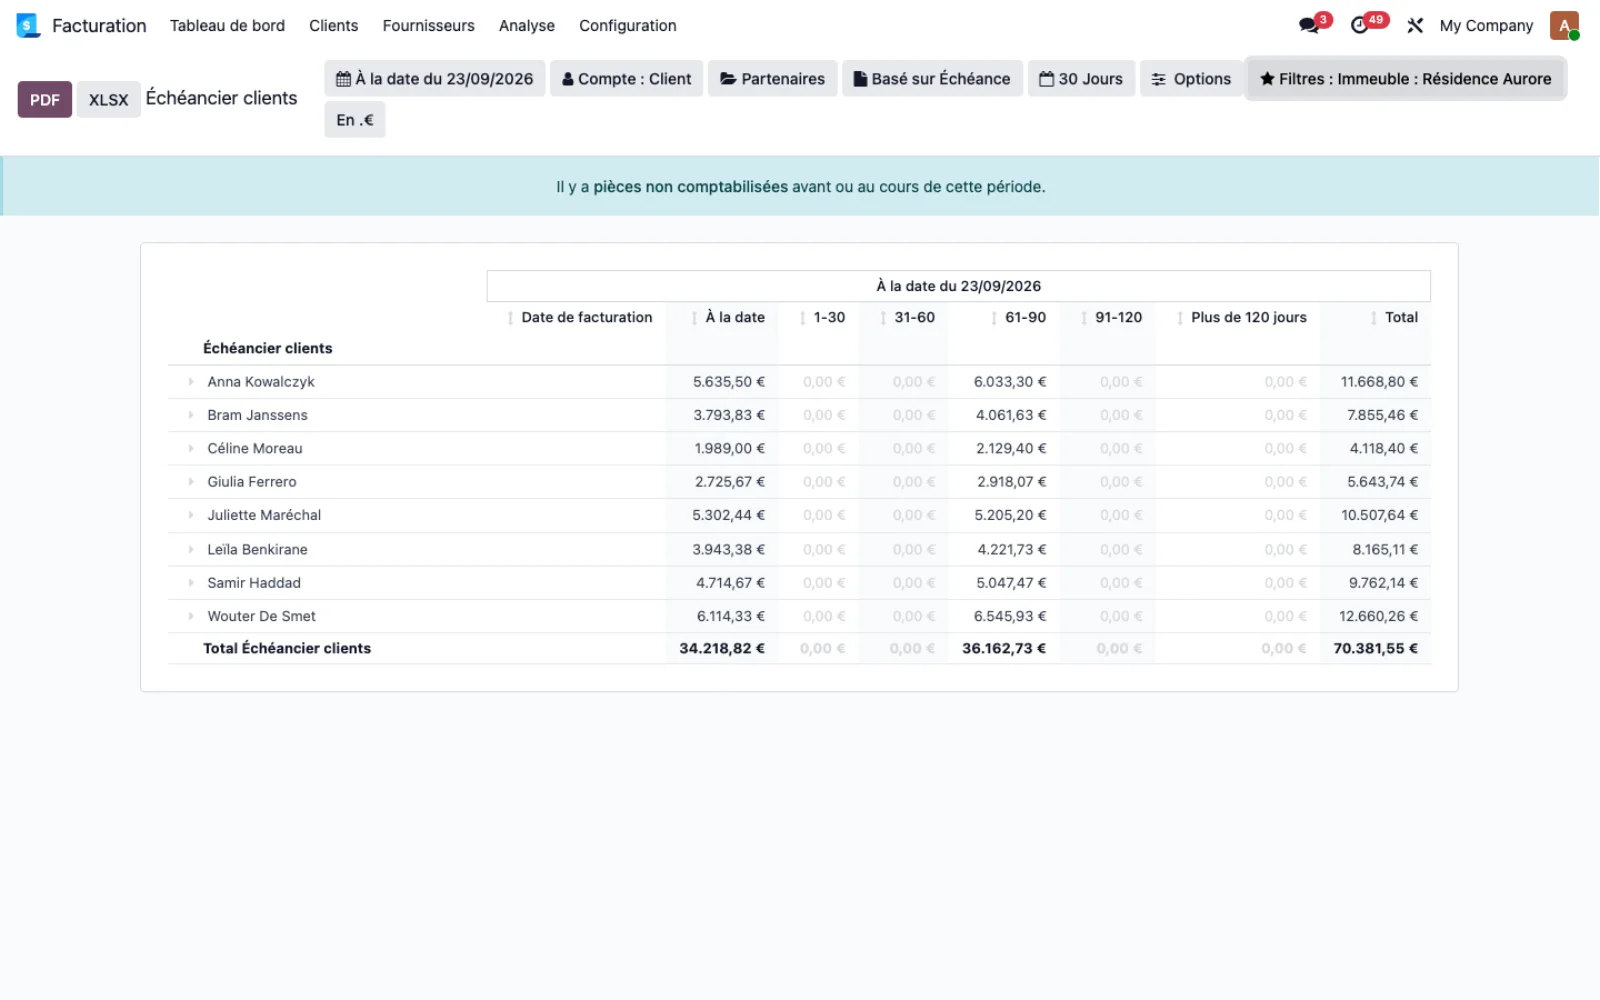
The potential rent of each building is divided into five parts that add up: collected, due but not collected, rent-free period, vacancy, and falling due or not invoiced. A quarterly invoice feeds each of the three months it covers, not the month in which it is issued, and a rent-free period granted is never counted as unpaid. The standard Odoo aged balance can be filtered by building, to read the outstanding balance of a single building without going through the whole portfolio.
See TSC Immo on your own cases
A demonstration on a database with fictitious data, then on your own management questions.
 Connect. Transform. Grow.