Required profile: read-only access to view, service charge manager and system administrator to set the parameters.
Step 1 · Set the thresholds
Open Immo > Configuration > Settings, Rent collection block: the grace period in days (3 by default) and the two colour thresholds (40% and 70% by default). A rent whose due date has not passed by that period is not yet payable.
Step 2 · Read the dashboard
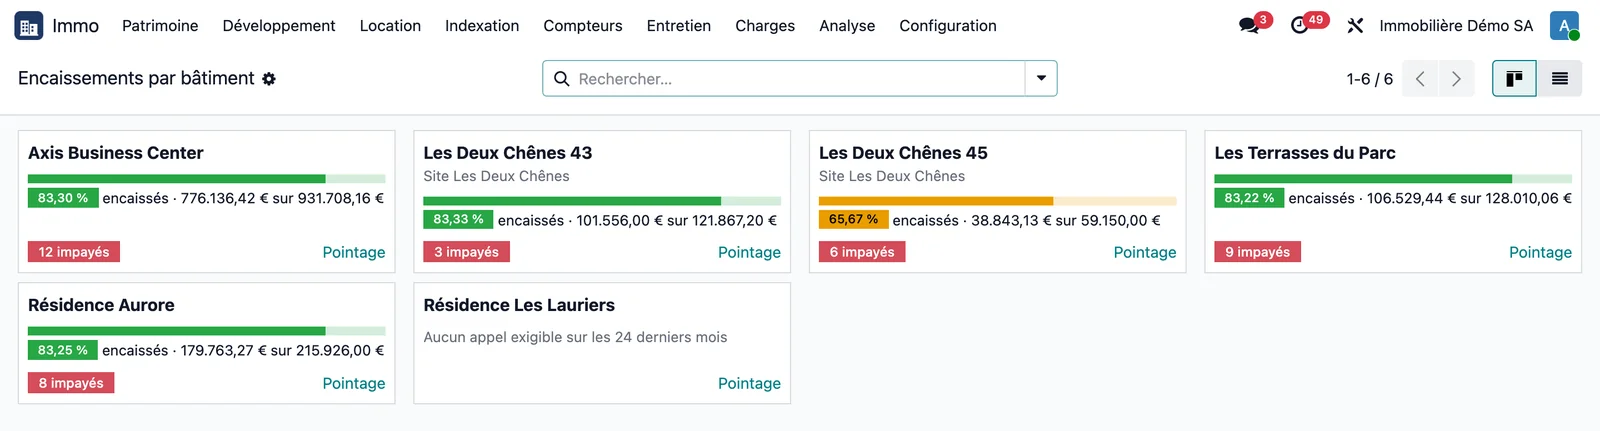
Open Immo > Analysis > Collections by building. Each card shows a bar and the collection rate over a rolling 24 months, the amount collected against the amount due, and the number of unpaid rent calls. Red below the first threshold, orange between the two, green above. A building with no rent due says so in plain words rather than showing an empty bar.
Step 3 · Tick off rent payments
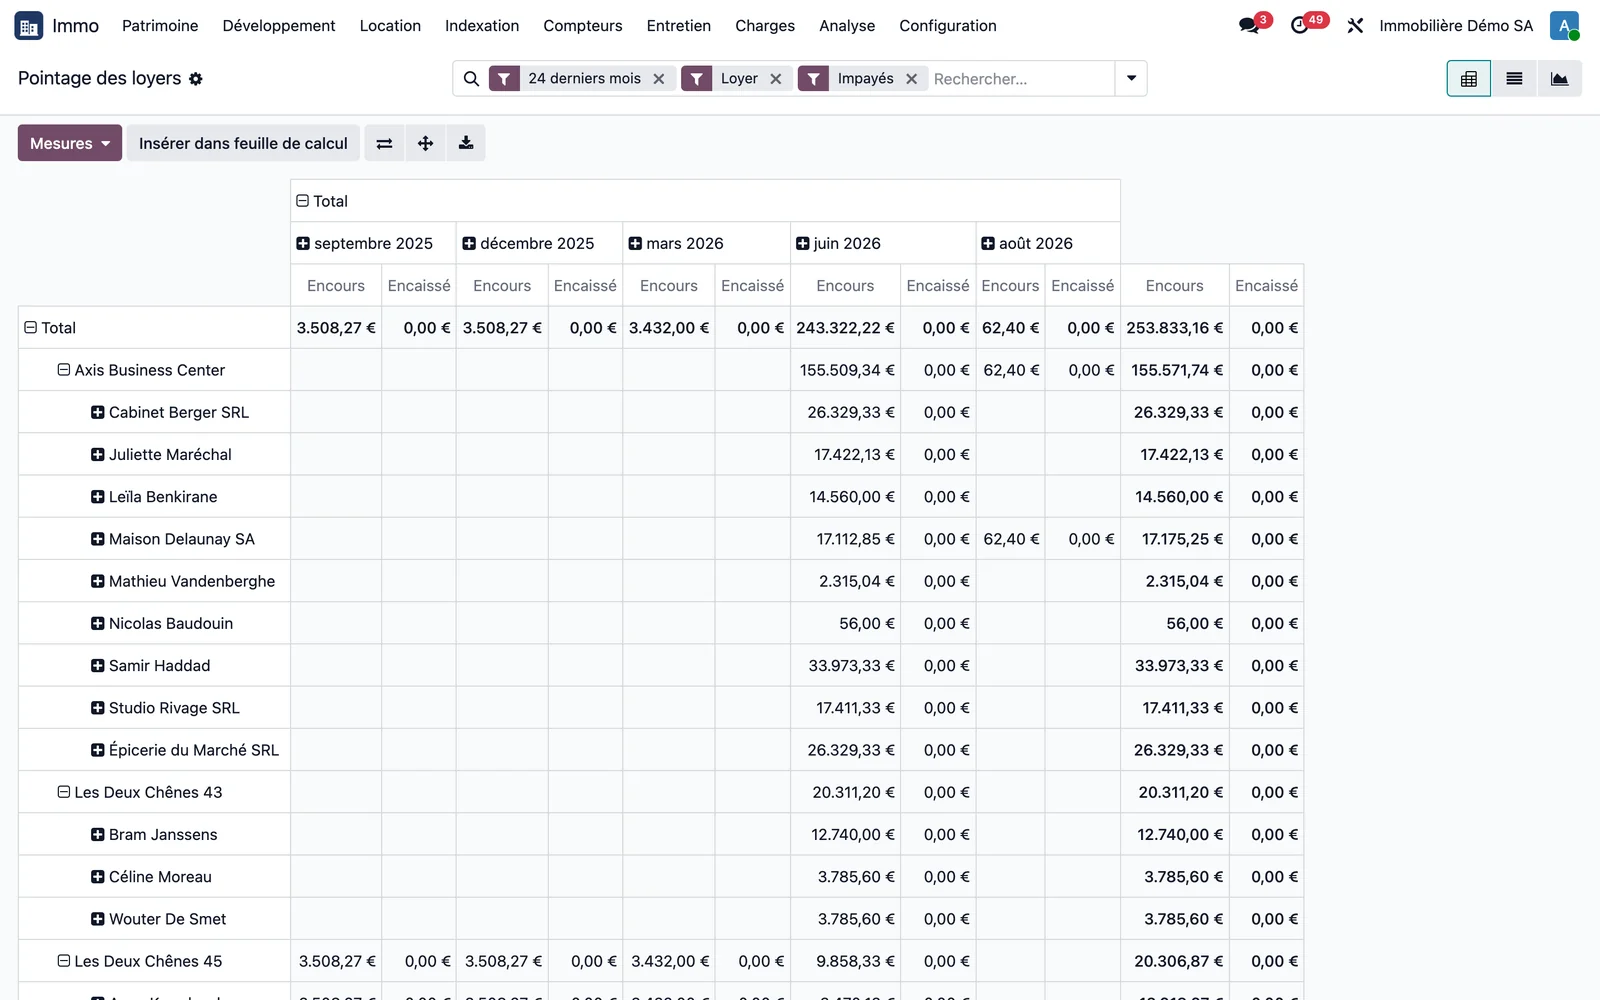
The Reconciliation button on a card opens exactly the lines it counted. Immo > Analysis > Rent reconciliation opens as a pivot table: buildings then tenants in rows, months in columns, outstanding and collected amounts as measures, over the rents of the last 24 months. The Unpaid, Not settled and Due filters change the view; the list view adds the amount called, cancelled, net called and days overdue. Manual reconciliation lets the property manager tick off their own checks.
Step 4 · Export to Excel
Immo > Analysis > Reconciliation export produces a formatted workbook for the chosen financial year: months in columns, green and red according to collection.
Step 5 · Read rent trends
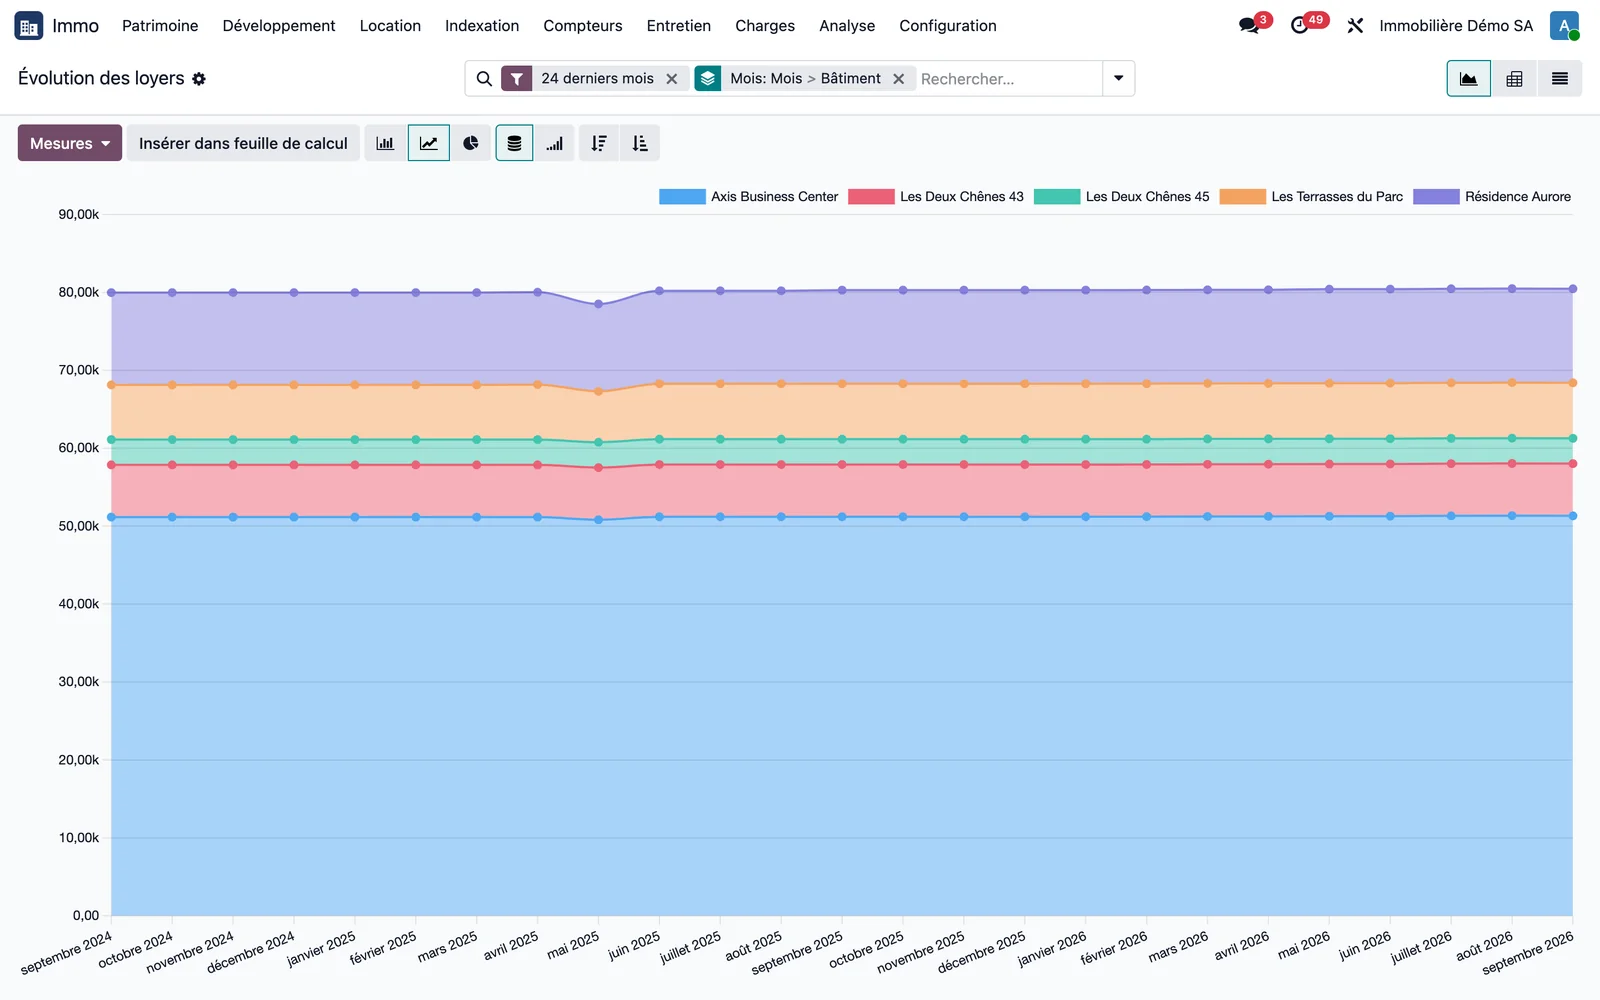
Immo > Analysis > Rent trends rebuilds, month by month, the applicable rent, indexations and rent step increases included, and the valued vacancy. The chart view opens on 24 months; the pivot table adds the lost rent, and the list shows whether each unit is let or vacant.
Step 6 · Read profitability by building
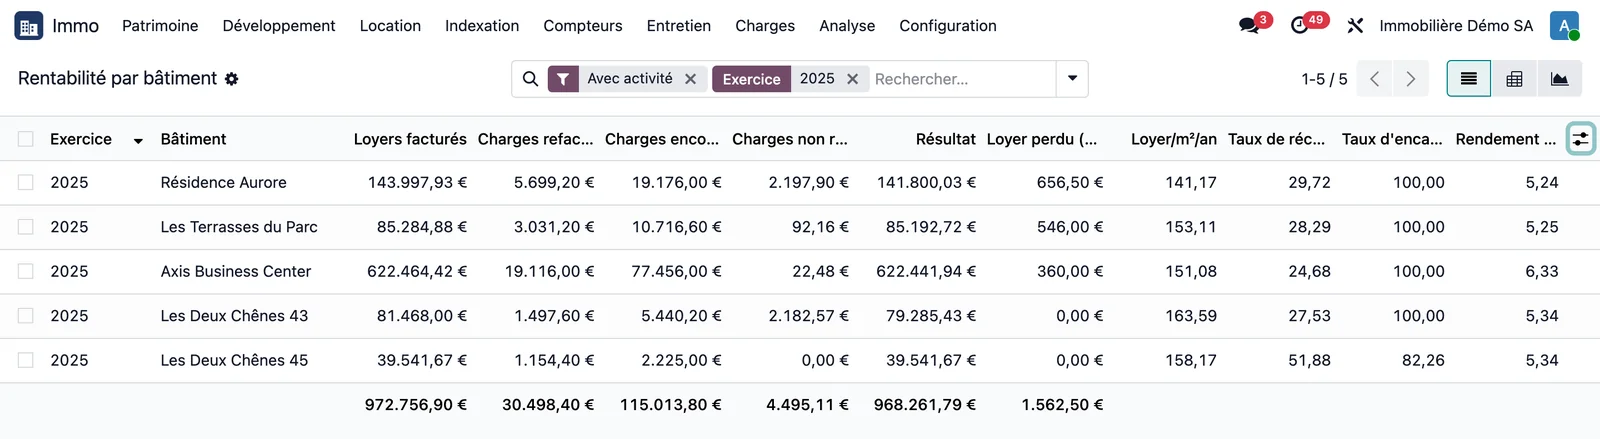
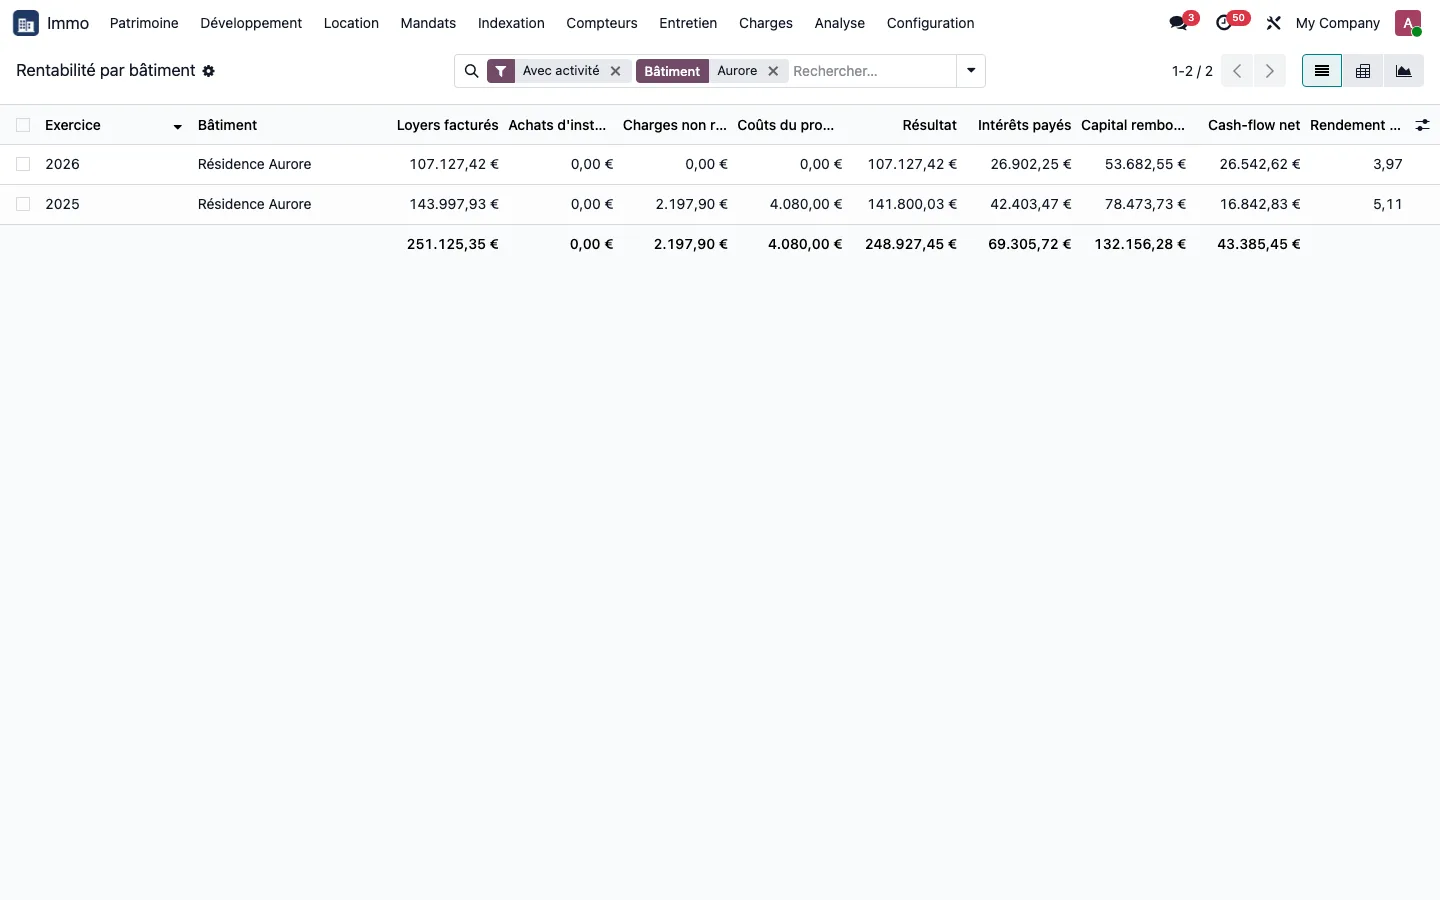
Immo > Analysis > Profitability by building gives, for each financial year: rent invoiced, service charges recharged, service charges incurred, unrecovered service charges (the owner's share), result, vacancy days, lost rent, rent per m² per year, recovery rate, collection rate and gross yield. The result equals rent invoiced minus unrecovered service charges. The "Collection below 90%" filter isolates buildings that are falling behind.
Step 7 · Open the portfolio dashboard
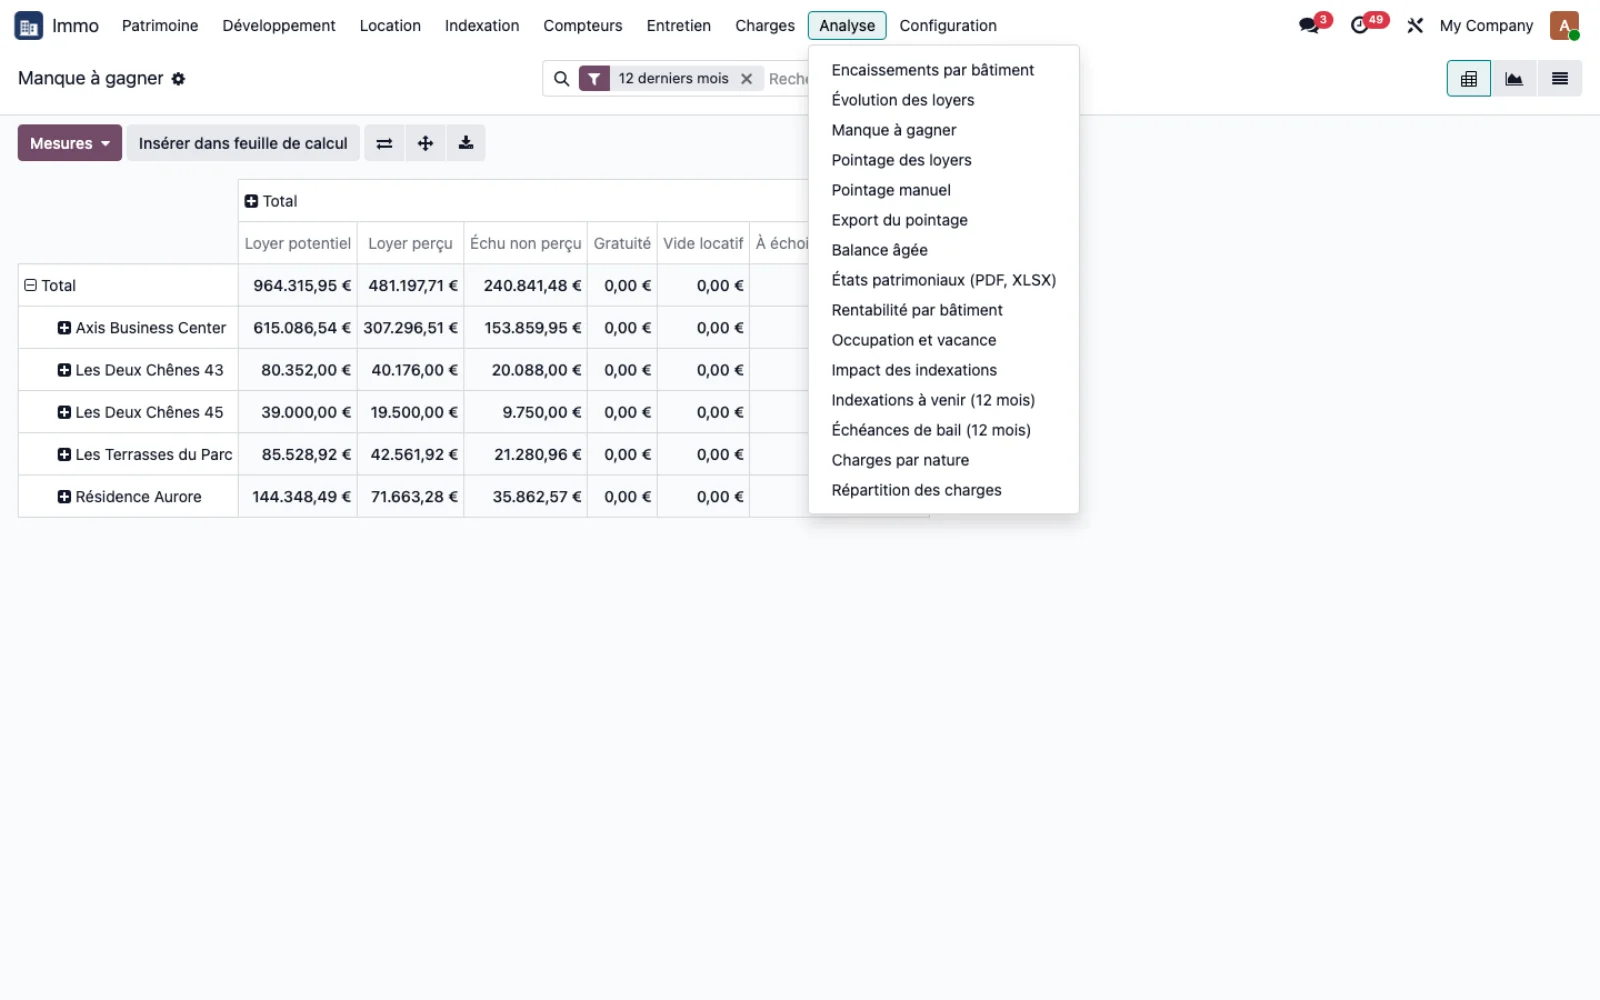
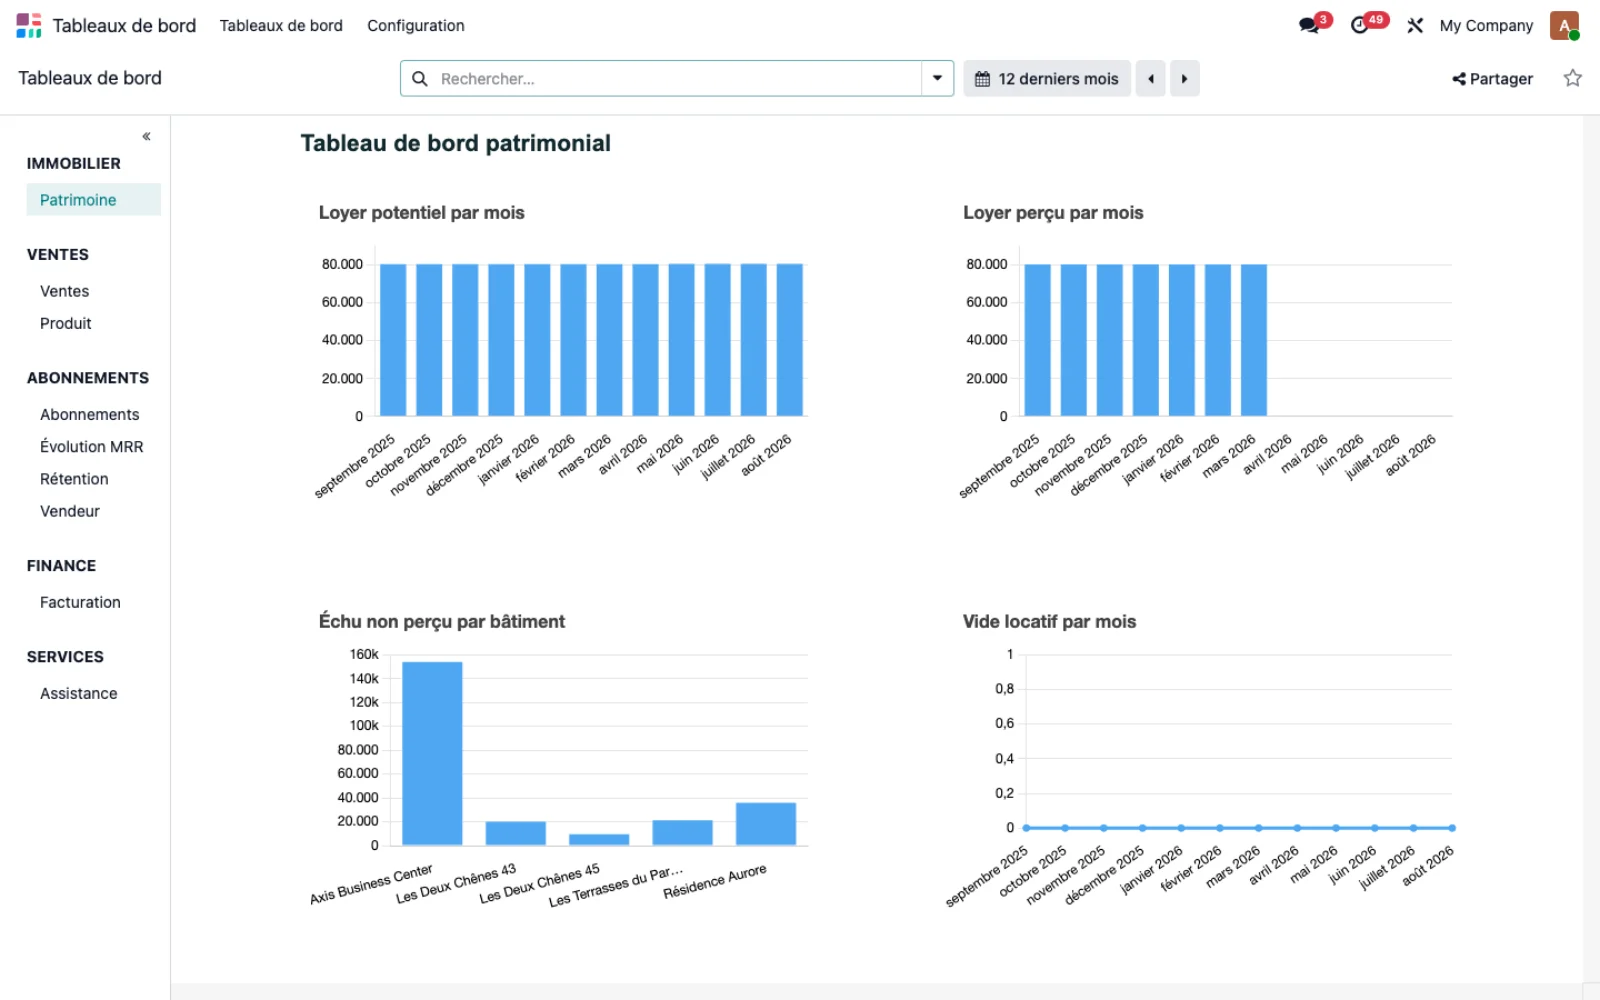
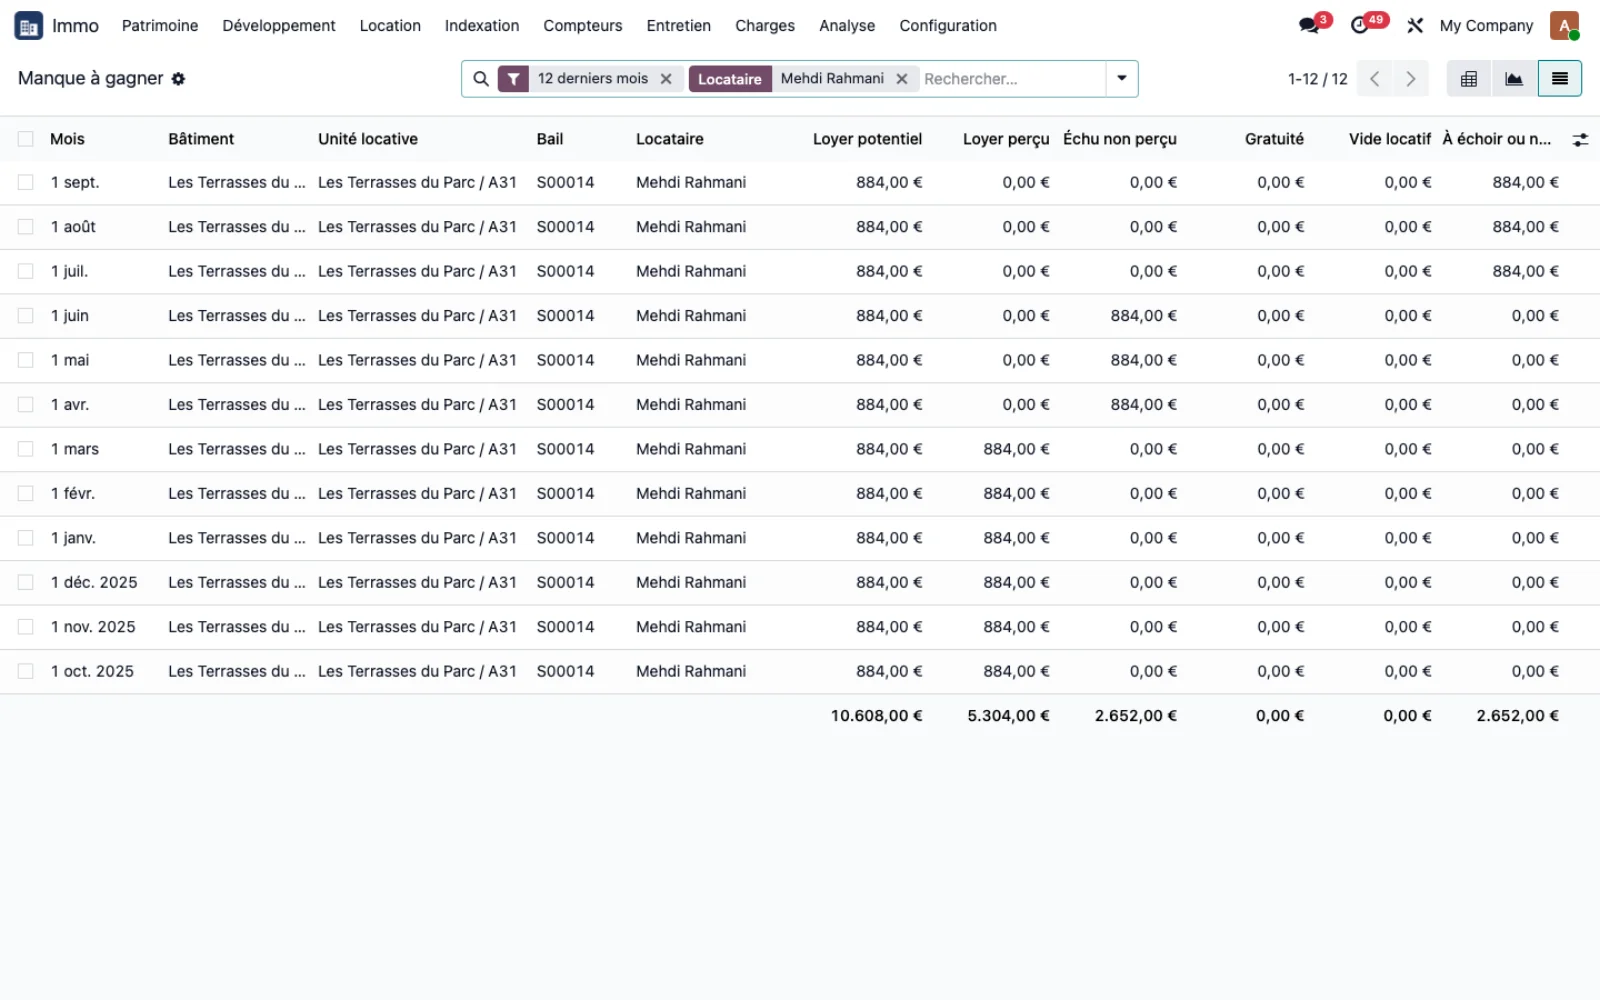
The Analysis menu now brings together the dashboard, the shortfall, the aged balance, the portfolio statements and the twelve-month lists, alongside the existing reports. Immo > Analysis > Portfolio opens the dashboard: potential rent and rent received per month, overdue and unpaid by building, and vacancy, filterable by period.
Step 8 · Read the shortfall
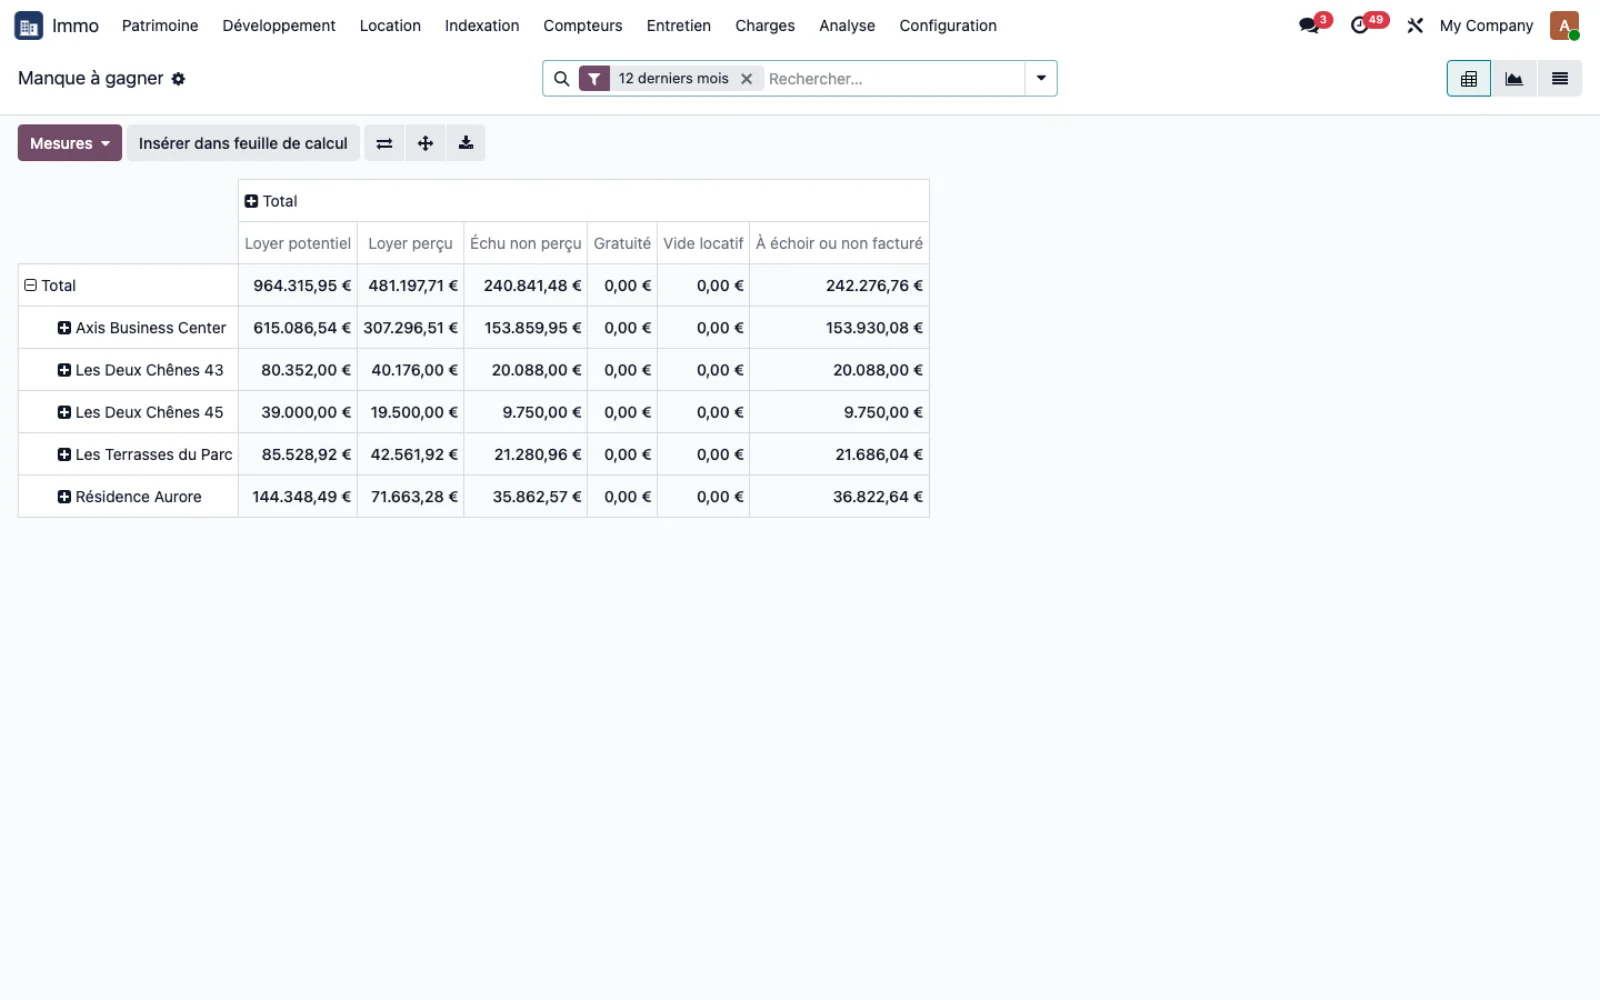
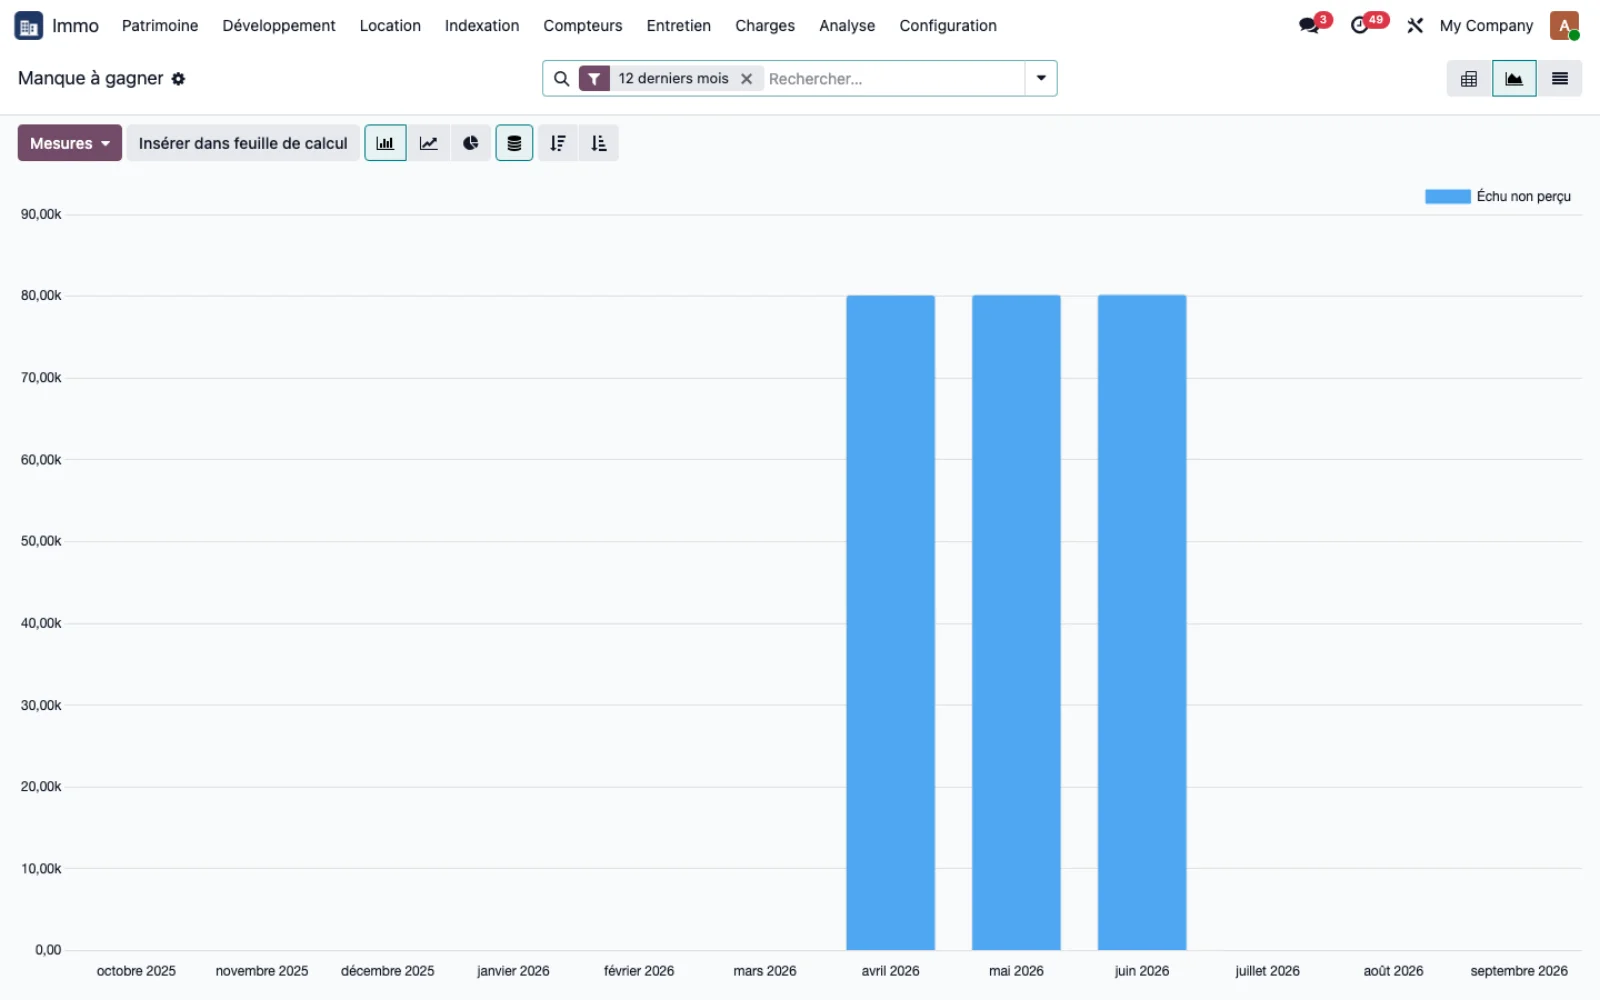
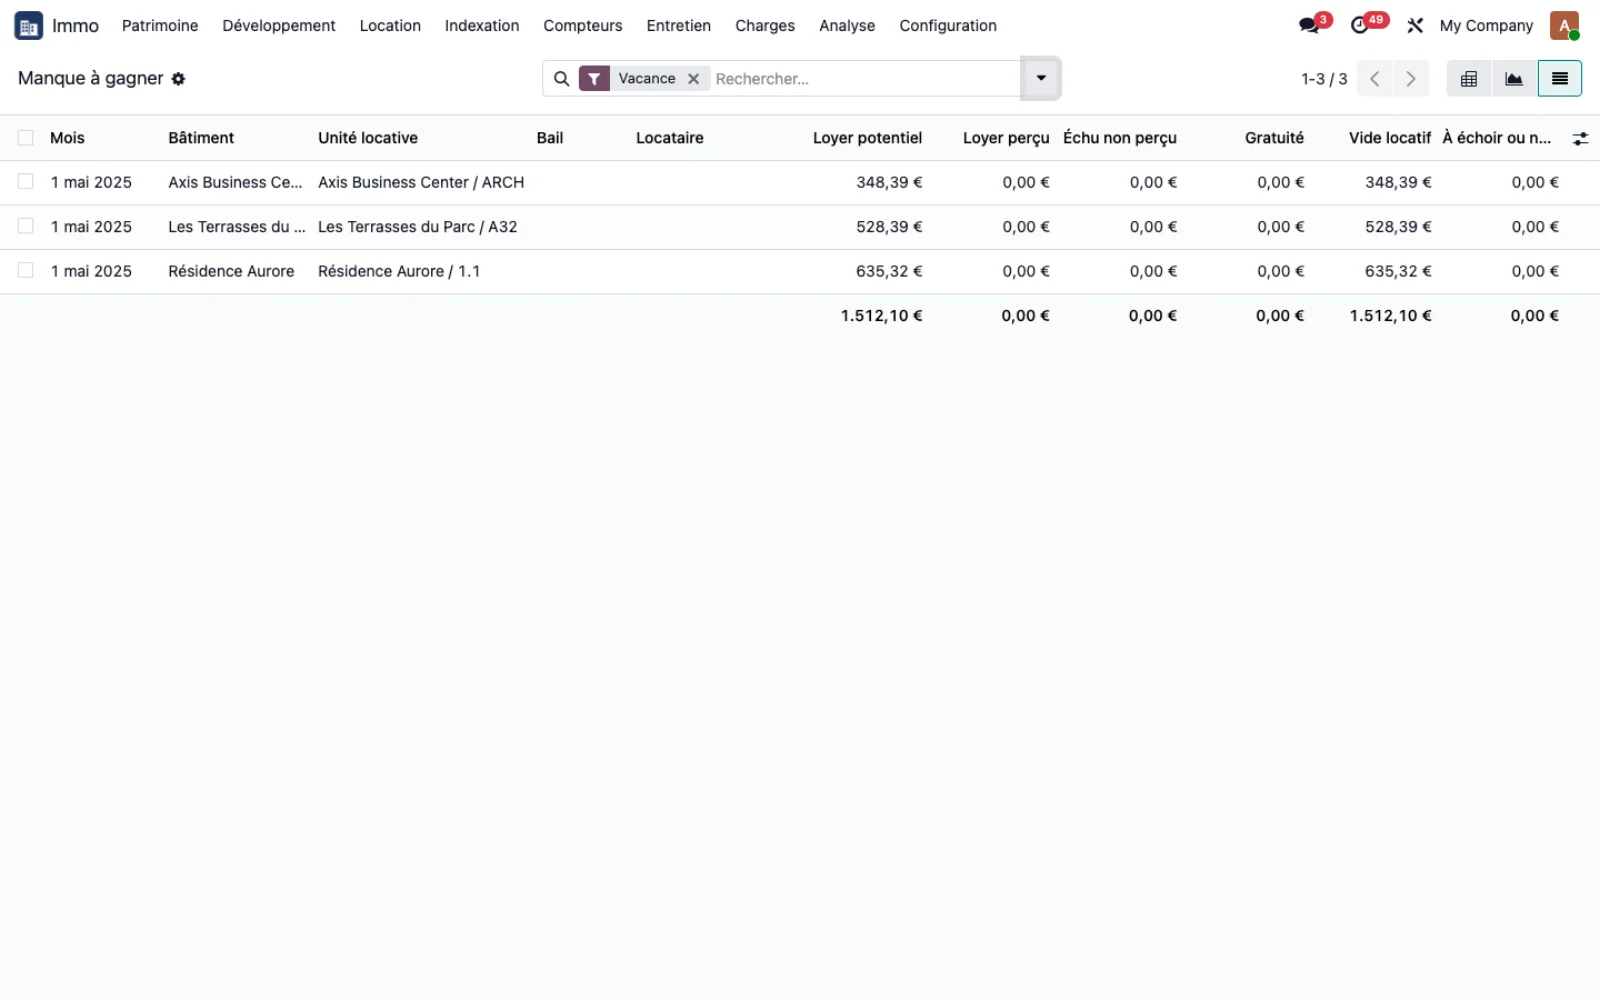
Immo > Analysis > Shortfall breaks down, building by building, the potential rent into five parts that add up: rent received, overdue and unpaid, rent-free period, vacancy, and not yet due or not invoiced. The chart view isolates the overdue and unpaid amounts month by month, to show where the shortfall is concentrated.
Step 9 · Understand the period served
A quarterly invoice feeds each of the three months it covers, not the month in which it is issued: the shortfall remains readable month by month even for a lease invoiced quarterly. A paused or terminated lease does not appear in the shortfall, and a rent-free period that has been granted is never counted as an unpaid amount.
Step 10 · Filter the aged balance by building
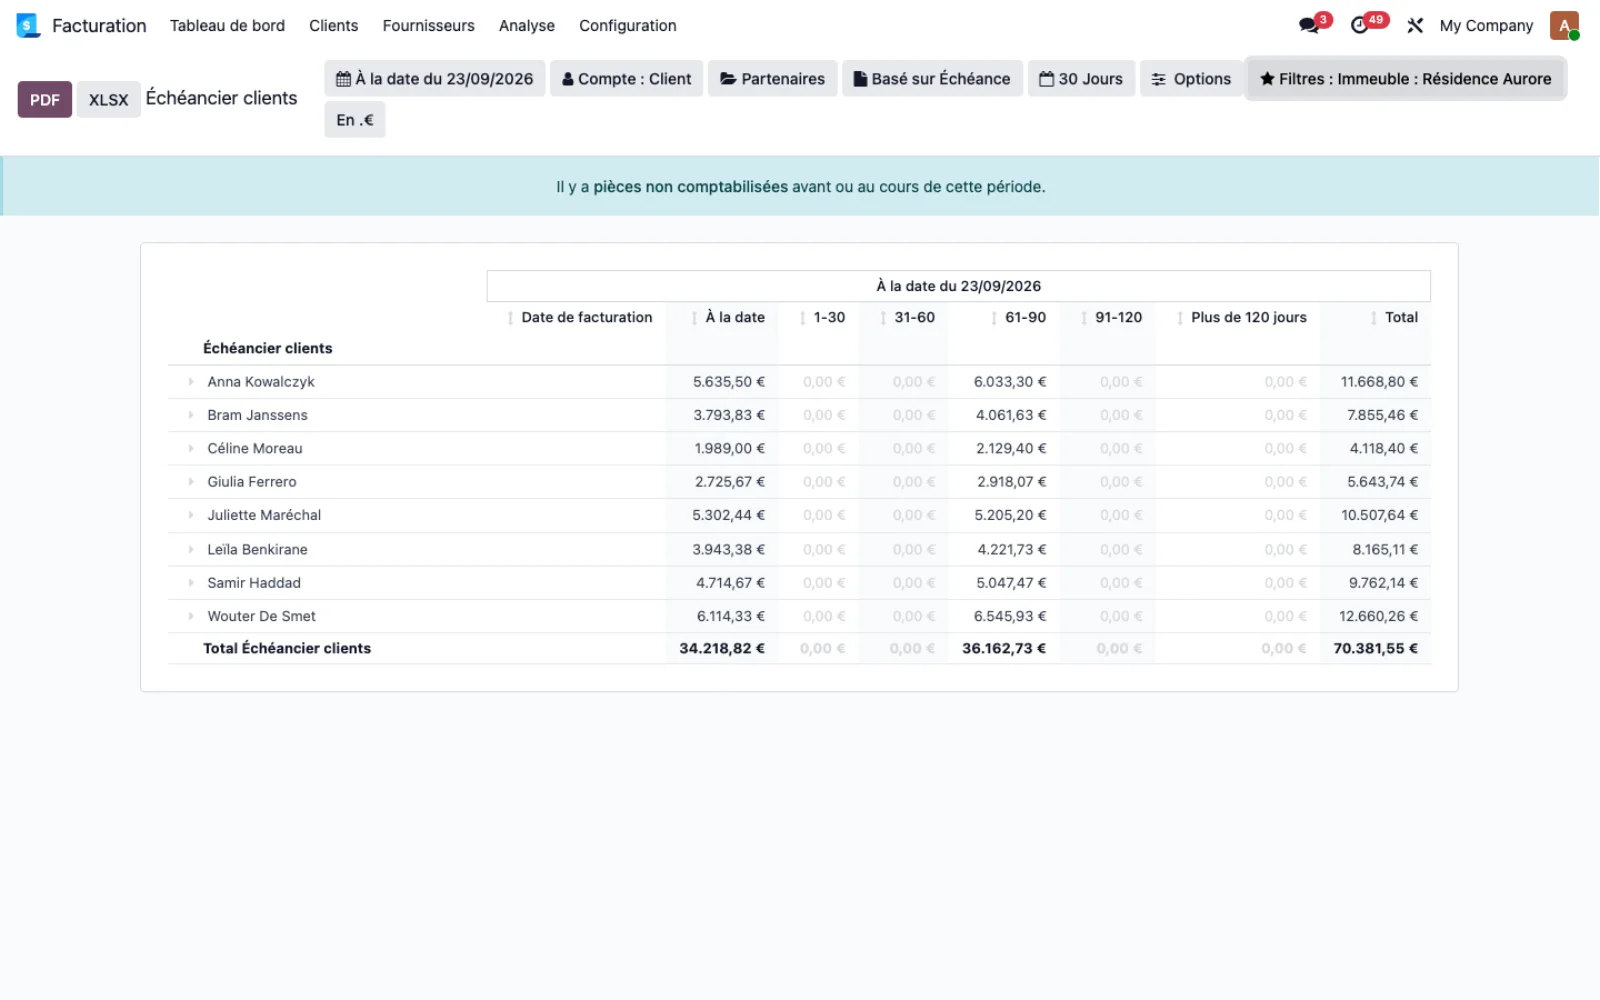
Immo > Analysis > Aged balance opens Odoo's standard customer aged receivables report, with an added Building filter alongside the usual filters: the outstanding amount of a single building, by tenant and by age bracket, without pulling in the whole portfolio.
Step 11 · Export the portfolio statements
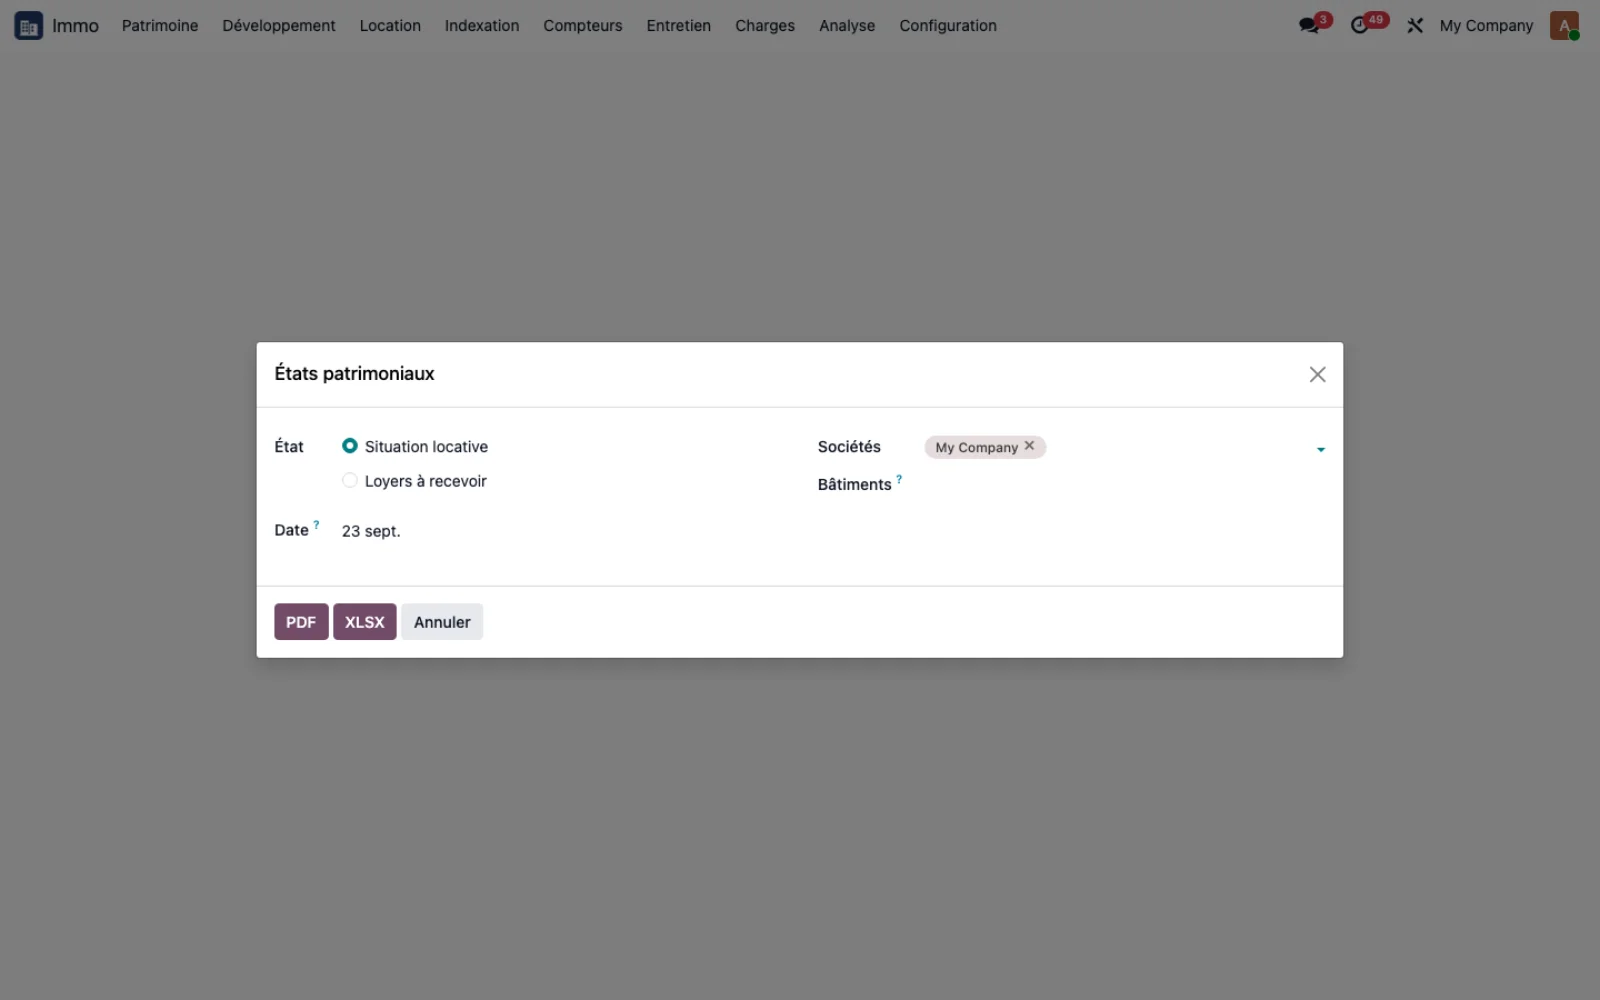
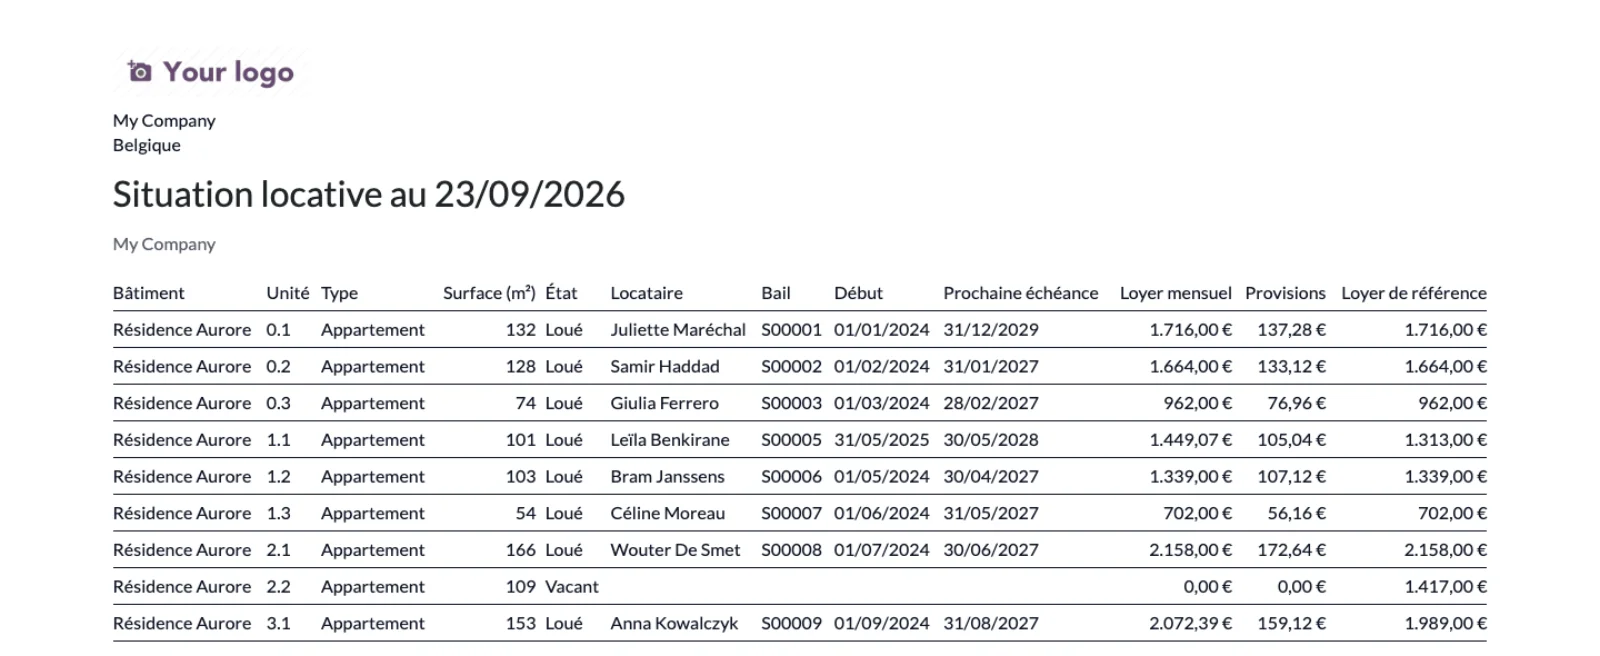
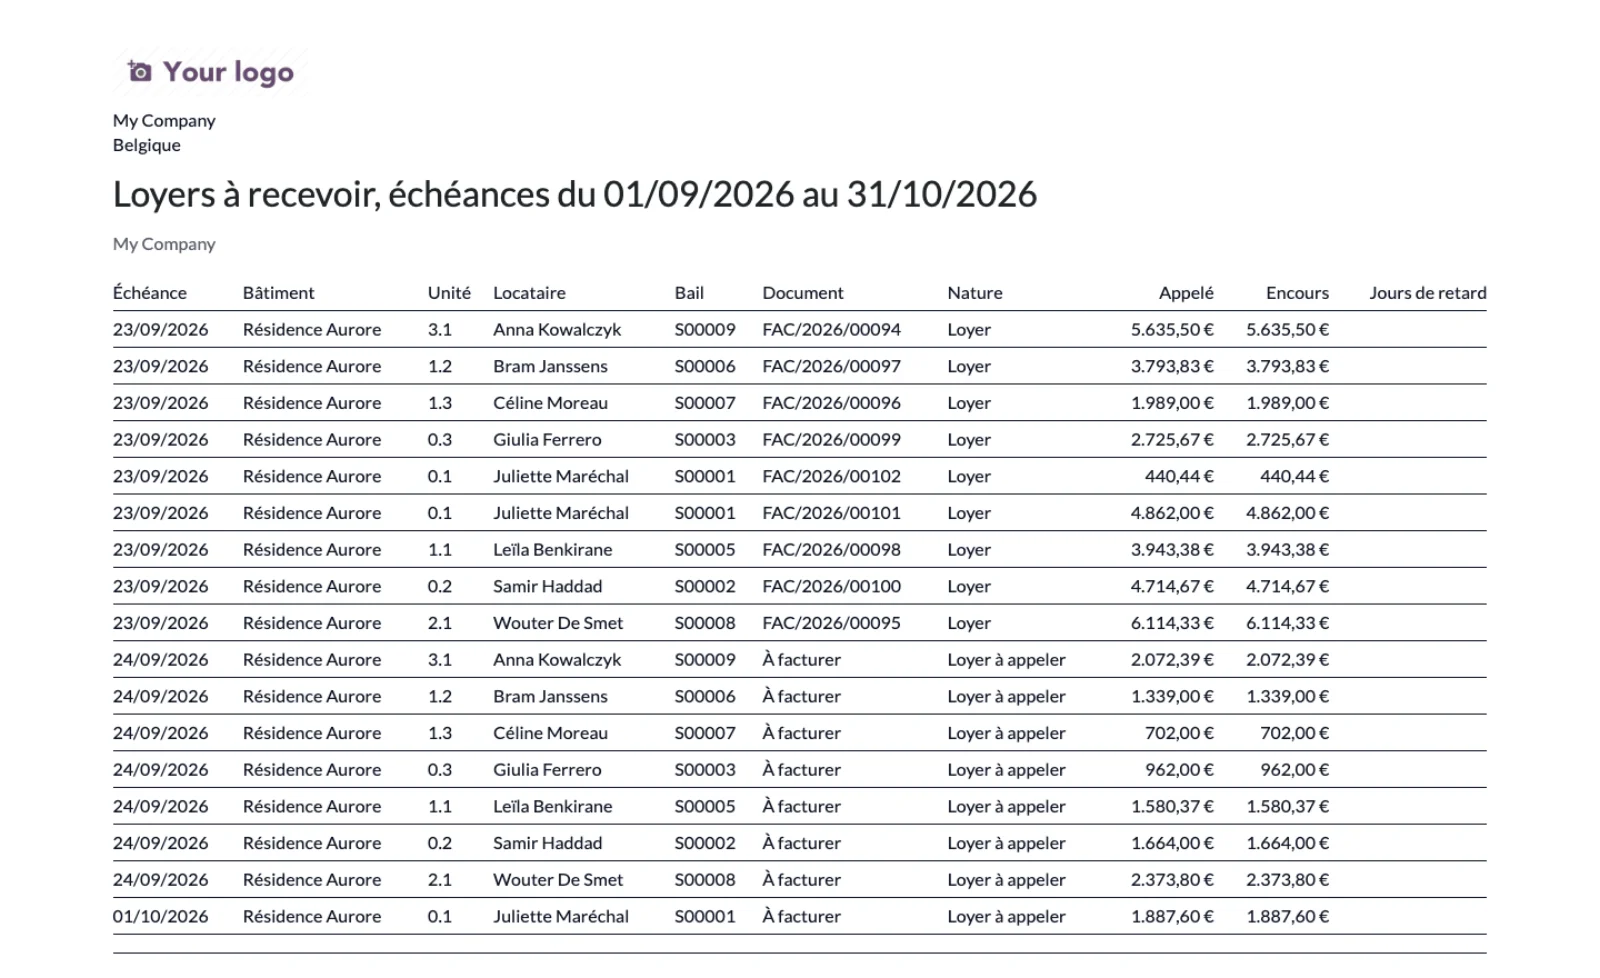
Immo > Analysis > Portfolio statements opens a wizard: Rental situation or Rents receivable, filterable by company and by building, at a given date, exported to PDF or XLSX. The rental situation lists each unit, its tenant, its rent and its service charge advances, vacancy included. Rents receivable lists the current month and the following month, with days overdue.
Step 12 · Track indexations and lease expiries over twelve months
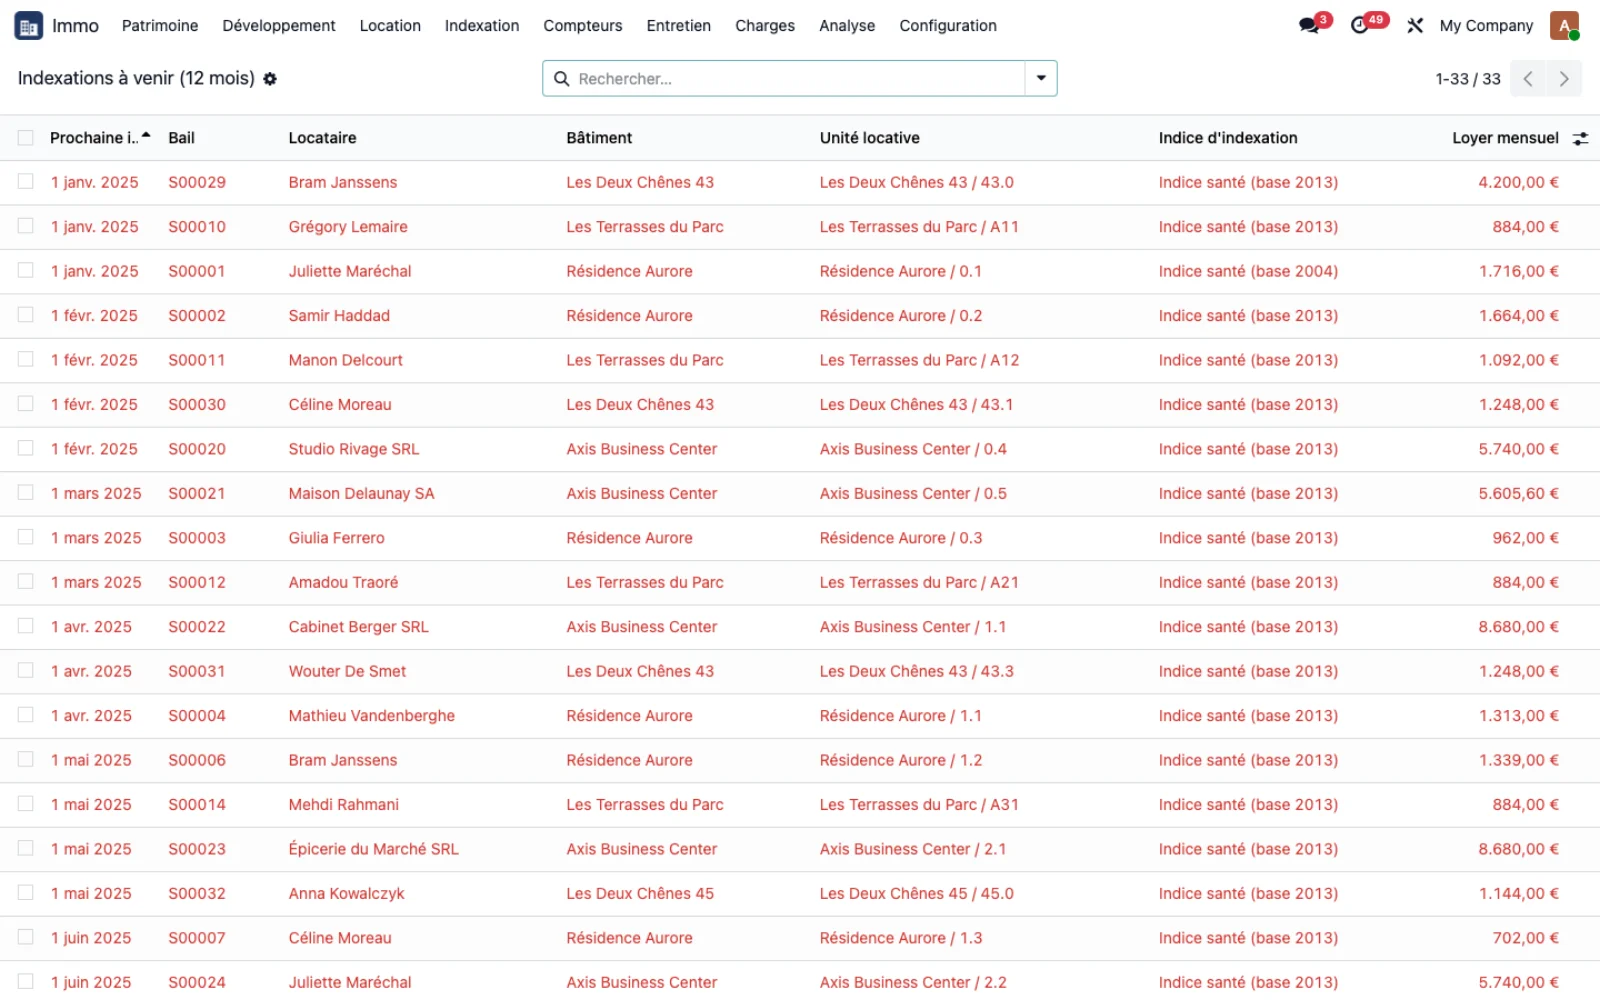
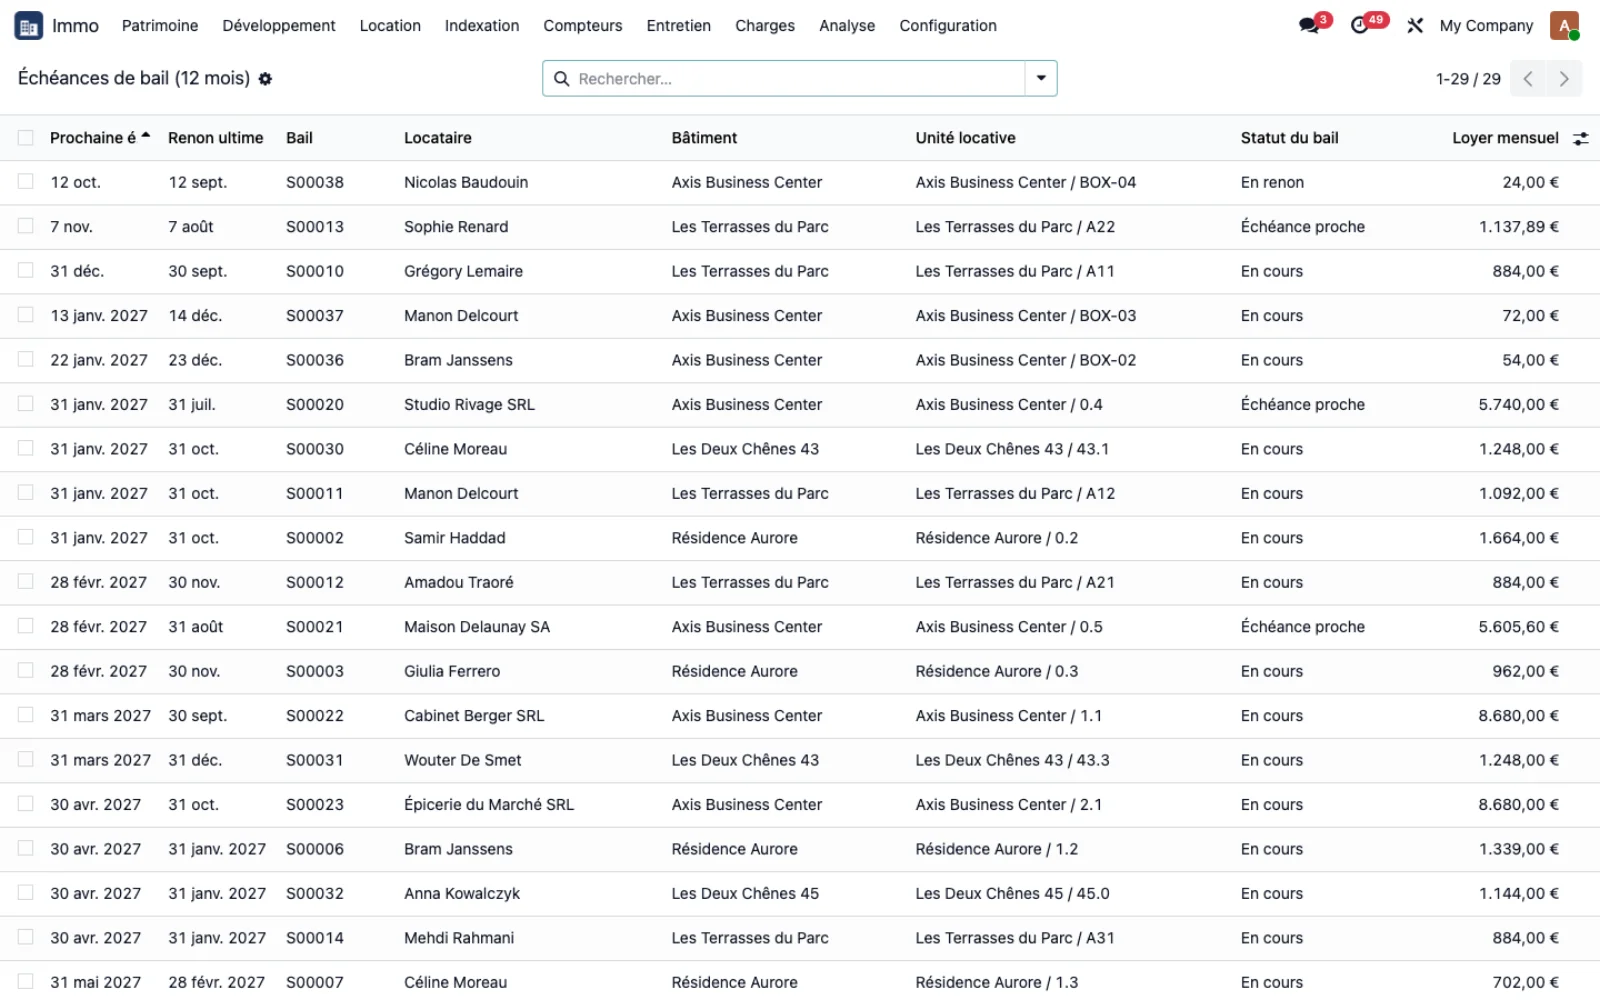
Two working lists complete the Analysis menu. Upcoming indexations (12 months) sorts leases by next indexation, index applied and monthly rent. Lease expiries (12 months) sorts by next expiry and final notice date, with the lease status. A month of vacancy between two tenants appears as a separate line in the shortfall, valued at the unit's reference rent.
Step 13 · Finance a building and read its net yield
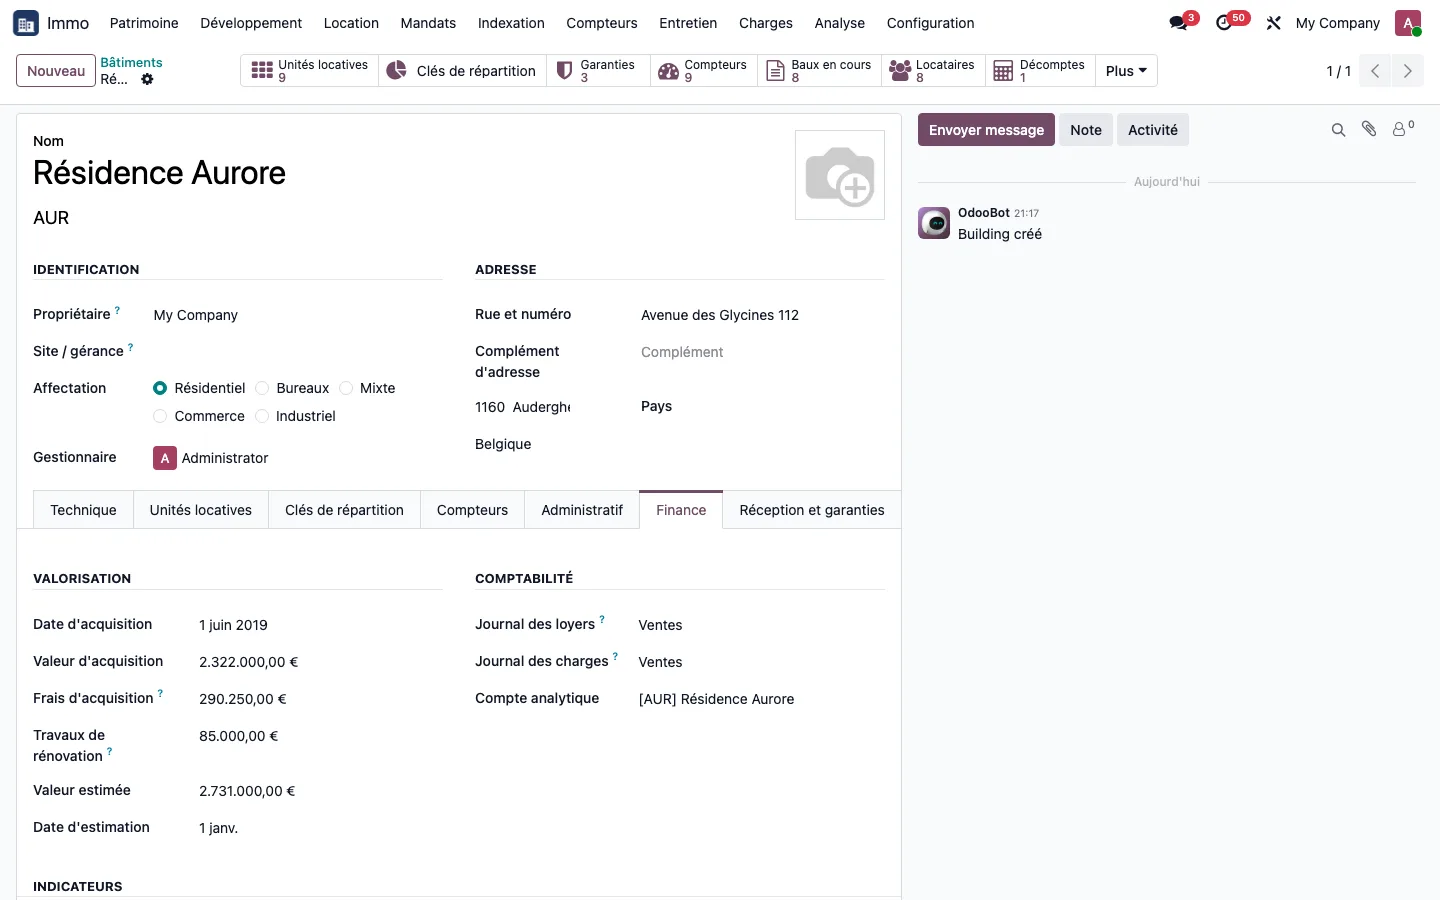
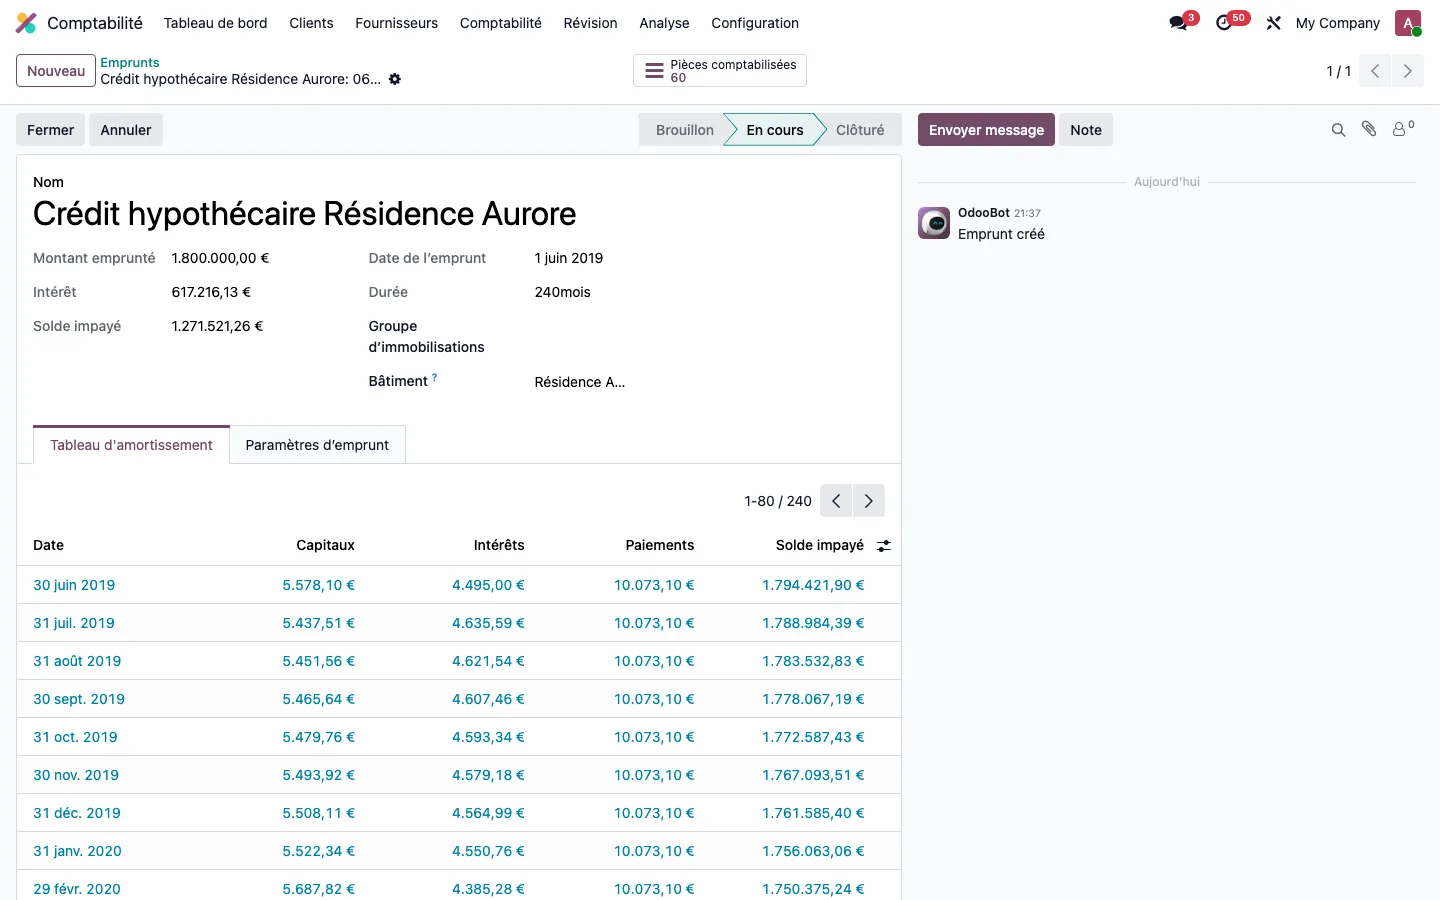
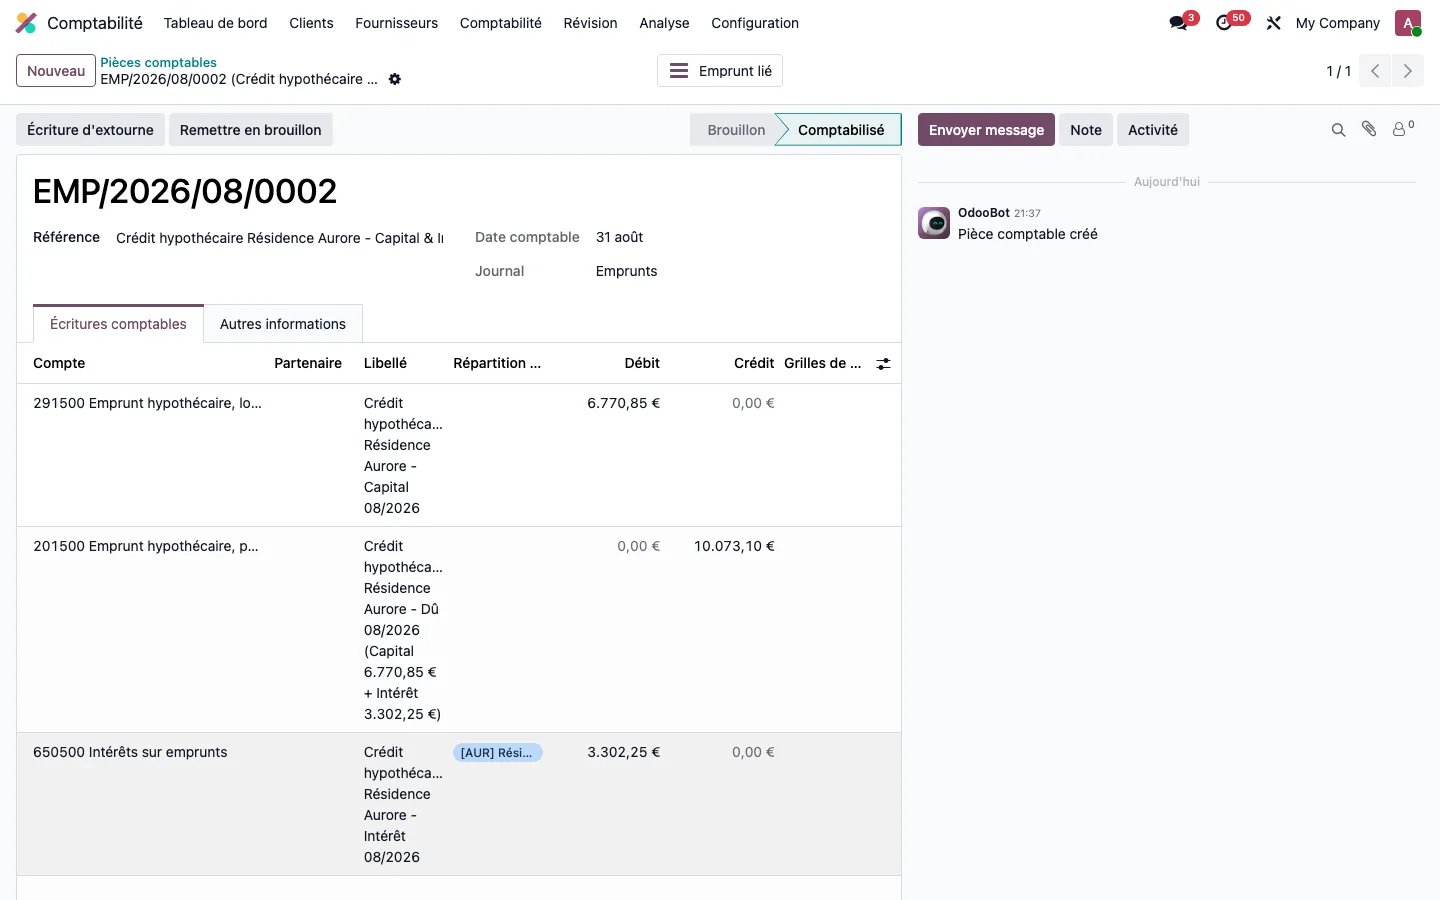
On the building record, enter the purchase value, the acquisition costs and the renovation works. Create the loan in Accounting > Loans, calculate or import its amortisation schedule, and choose the building being financed. Each instalment posts its interest to the building's analytic account, never the capital. Immo > Analysis > Profitability by building then shows, alongside the gross yield, the interest, the capital, the net cash flow and the net yield on the total investment, financial year by financial year.
Key points
The dashboard rate (rolling 24 months, grace period, capped at 100%) and the profitability-by-building rate (calendar year, all calls issued) cannot be compared.